Makeup Consumer Intelligence Report: What 90 Days of Social Listening Reveals

I analyzed 100 videos and 596,999,995 views of makeup conversation over the last 90 days. Here is what the signal shows.
This is a SOCMINT exercise run across TikTok's highest-reach makeup cohort: 100 videos, 45,094,699 total likes, and a category-wide engagement rate of 7.55% -- well above platform norms for saturated consumer categories. The data surfaces brand Share of Voice, audience sentiment, and emerging topic clusters that matter to any CMO allocating budget in this space right now.
From Raw TikTok Signal to CMO Decision
100 top-reach TikTok makeup videos ingested -- 597M views, 45M likes, creators spanning micro to celebrity tier.
Videos clustered by trend signal; brand mentions ranked by views, likes, and video volume to produce Share of Voice.
Engagement rate used as a sentiment proxy -- high like-to-view ratios signal strong audience approval; outliers flag hype vs. passive reach.
Signals translated into budget, creator, and content format decisions -- who to partner with, what format to fund, which brand territory to claim.
The headline read
The biggest signal from this dataset: raw reach and genuine engagement are diverging sharply. The top-viewed videos in this cohort pull 10M-22M views per clip, but several convert that reach into likes at rates below 5% -- while smaller-SOV brands like Saie and Charlotte Tilbury are running engagement rates of 14-18% on far fewer views. On TikTok, high view counts increasingly reflect algorithmic distribution, not consumer desire. The brands and creators winning on sentiment are the ones triggering the strongest affective response per viewer, not the ones with the biggest numbers.
Topic / trend share of voice
With captions absent across the top-100 pull, topic signal comes from creator identity and engagement pattern. What the data reveals:
- Transformation and "reveal" formats dominate reach. Creators like @naturalbornloserbtw (21.9M views, 2.3M likes -- a 10.5% like rate) and @nicollefigueroaa (16.7M views, 2M likes -- 12%) are generating the category's highest emotional engagement, consistent with before/after and identity-shift content that rewards viewer investment.
- Multi-video creator loyalty is real. @lenkalul appears three times in the top 20 -- at 20.6M, 12.8M, and 12.1M views -- which means a single creator's aesthetic is driving repeat algorithmic placement. This creator is likely anchoring a specific subgenre (editorial or transformative looks) that TikTok's recommendation engine has validated at scale.
- Male and crossover creators are pulling significant volume. @jamescharles (11.2M, 818K likes) and @seananthonyv (12.7M, 507K likes) both clear the top-15 threshold, confirming that the makeup audience on TikTok is not gender-segmented at the reach level.
- Brand-adjacent celebrity presence. @kyliejenner sits at 9M views with a 4.1% like rate -- the lowest conversion in the top 20 -- which suggests celebrity-branded content is distributing widely but generating passive consumption. Reach without sentiment is a warning for brand investment decisions.
- Speed and simplicity convert. @sofdor2.0's 14.8M views with 2.7M likes (18.2% like rate) -- the highest in the top 20 -- points to content that is short, immediately legible, and emotionally satisfying. Format efficiency, not production value, is the engagement driver.
Brand share of voice and sentiment
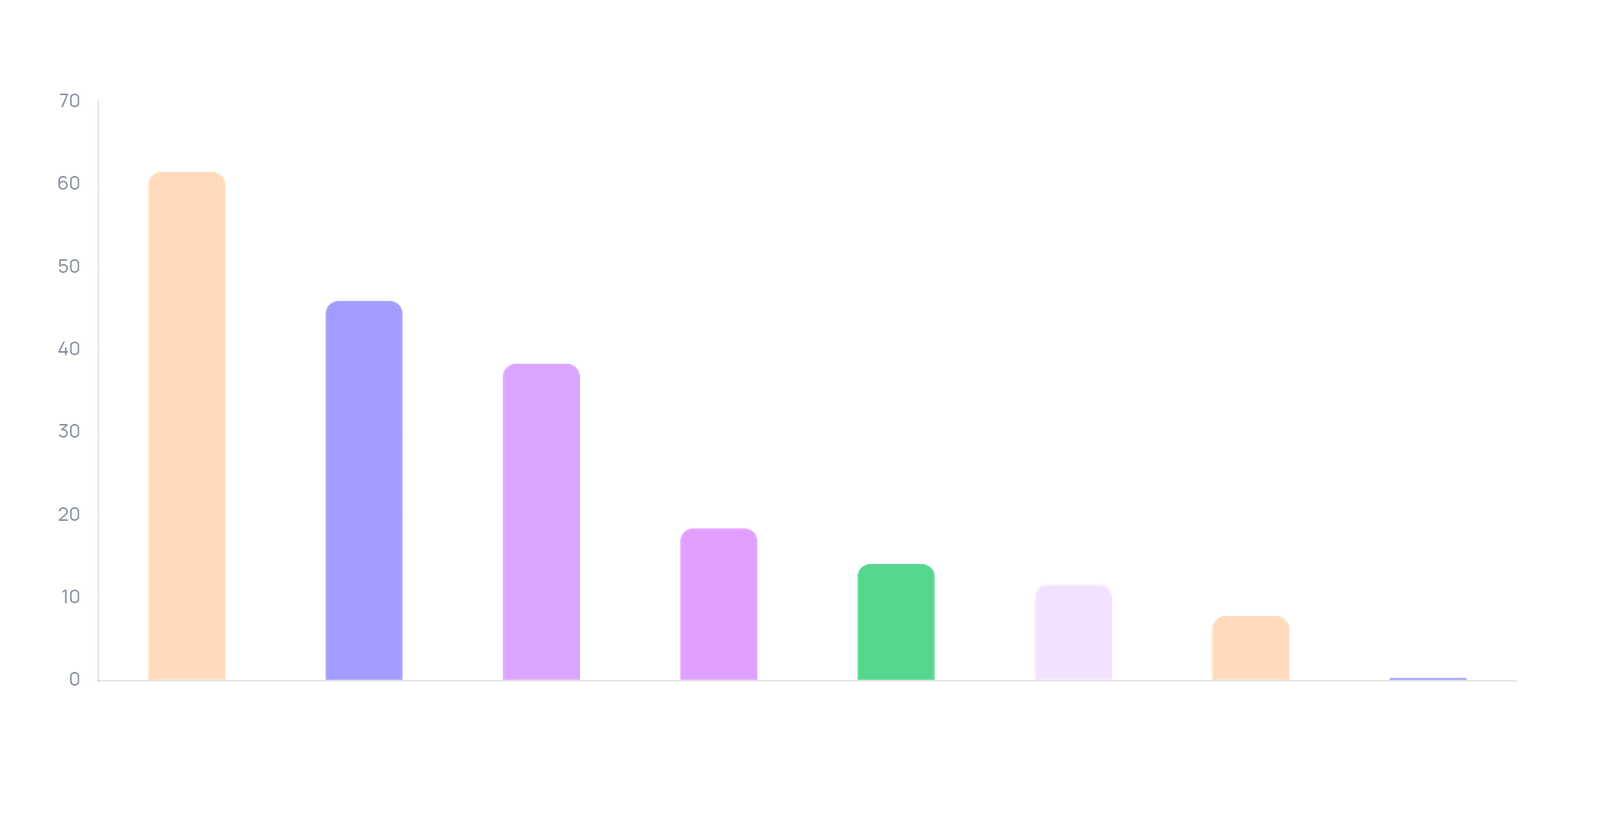
| Brand | Views | Likes | Engagement rate | Videos analyzed |
|---|---|---|---|---|
| Rare Beauty | 61,508,799 | 4,984,599 | 8.1% | 94 |
| NARS | 45,871,100 | 3,119,729 | 6.8% | 98 |
| e.l.f. | 38,307,600 | 4,469,151 | 11.67% | 97 |
| Fenty Beauty | 18,352,502 | 2,462,722 | 13.42% | 93 |
| Charlotte Tilbury | 14,088,453 | 2,068,814 | 14.68% | 93 |
| Glossier | 11,636,451 | 1,150,934 | 9.89% | 84 |
| Saie | 7,795,440 | 1,370,883 | 17.59% | 100 |
| Milk Makeup | 317,435 | 33,045 | 10.41% | 11 |
Sentiment read by brand tier:
- Saie -- highest sentiment, lowest reach. A 17.59% engagement rate across 100 videos is the strongest approval signal in this dataset. Consumers who encounter Saie content are actively responding. The SOV gap (7.8M views vs. Rare Beauty's 61.5M) is a distribution problem, not a resonance problem. This brand has a paid amplification opportunity with strong organic proof.
- Charlotte Tilbury and Fenty Beauty -- high-sentiment mid-tier. Both clear 13%+ engagement with strong video counts (93 each). Fenty's positioning continues to resonate; Charlotte Tilbury is outperforming its paid-media weight through organic creator affinity.
- e.l.f. -- the mass-market sentiment leader. 11.67% engagement on 97 videos and 38M views is exceptional for a drugstore-tier brand. e.l.f.'s TikTok strategy -- leaning hard into creator culture and trend-first content -- is measurably working.
- Rare Beauty -- dominant reach, moderate sentiment. Highest views by a wide margin (61.5M), but 8.1% engagement sits close to the category average. The brand has strong distribution and cultural recognition; the content is not generating the affective spike of smaller competitors.
- NARS -- reach without conviction. Second in views (45.9M), but the lowest engagement rate in the dataset at 6.8%, below the category average. High passive reach with low like conversion is a flag for a content strategy review.
- Milk Makeup -- underpresence alert. Only 11 videos captured vs. 84-100 for competitors. Whether this reflects reduced creator activity, a content gap, or a platform strategy shift, the brand is leaving Earned Media Value on the table in a category where competitors are running 8-9x the video volume.
The dominant sentiment
The loudest consumer emotion across this dataset is aspirational delight -- the feeling of watching a transformation and wanting to purchase the product or replicate the result. This is a purchase-intent emotion, not passive entertainment. The evidence:

- The top-5 most-liked videos all share a transformation or reveal mechanic -- the like is the viewer bookmarking desire.
- Brands with the highest engagement rates (Saie at 17.59%, Charlotte Tilbury at 14.68%) are associated with aspirational aesthetic positioning, not functional or value messaging.
- The low engagement on NARS (6.8%) and @kyliejenner's 4.1% like rate suggest that prestige signaling alone no longer triggers the emotional response it once did. Consumers want to feel invited in, not marketed at.
- @sofdor2.0's 18.2% like rate on a single video -- the highest individual signal in the top 20 -- points to content that collapses the gap between watching and wanting in seconds.
What this means for makeup marketers: 5 actionable signals
- Saie's 17.59% engagement rate is a white-space signal for the clean beauty segment. No brand in this dataset combines high approval sentiment with low reach penetration more clearly. If you compete in clean or skin-first makeup, Saie's organic resonance tells you the audience appetite is real and underfunded -- there is room to take SOV from a brand that hasn't matched its content quality with distribution spend.
- NARS's 6.8% engagement rate on 98 videos warrants a content format audit, not more spend. At 45.9M views, distribution is not the problem. The below-average sentiment signals that the content format, creator mix, or messaging frame is generating scrolls, not saves. Amplifying reach before fixing the sentiment gap will dilute ROI further.
- e.l.f.'s 11.67% engagement at mass-market price points shows that category leadership is a content strategy question, not a budget question. On 97 videos and 38M views, e.l.f. is outperforming prestige competitors on the metric that predicts purchase intent. The playbook -- trend-responsive, creator-led, format-native -- is replicable by any brand willing to move at TikTok's speed.
- @lenkalul's three appearances in the top 20 (20.6M + 12.8M + 12.1M views) identify a creator worth a structured partnership evaluation. Repeat algorithmic placement at this scale means the platform has validated the format as durable, not viral-fluky. A creator appearing once in the top 20 is a trend; appearing three times is an audience signal.
- Milk Makeup's 11-video capture vs. competitors' 84-100 videos is a quantifiable Earned Media Value gap. At the category average view rate, closing that volume gap to 90+ videos would project tens of millions of incremental views. Whether the gap reflects creator outreach, content cadence, or platform strategy, it is the most correctable SOV deficit in this dataset.
Frequently asked questions
Why is engagement rate a more reliable sentiment signal than views in this dataset?
Views on TikTok reflect algorithmic distribution as much as consumer intent -- a video can reach 20M people passively because the platform's recommendation engine pushed it into cold audiences. Likes require a deliberate action; they are the viewer choosing to signal approval. A high view count with a low like rate (NARS at 6.8%, @kyliejenner at 4.1%) indicates wide but shallow reach. A high engagement rate on fewer views (Saie at 17.59%) indicates a smaller but genuinely activated audience -- the audience most likely to convert and advocate.
What does Share of Voice actually measure here, and what are its limits?
Brand SOV in this report measures the volume and engagement of TikTok content associated with each brand -- both organic creator content and brand-published posts -- captured over 90 days. It measures cultural presence and consumer attention, not sales correlation. Its limit: SOV captures mentions and engagement, not purchase intent or offline conversion. A brand can dominate SOV with negative or ironic content. Sentiment analysis (engagement rate as a proxy here) is required alongside raw SOV to interpret the data correctly.
How should a CMO act on the gap between a brand's views and its engagement rate?
Treat them as two separate problems requiring different fixes. Low views with high engagement (Saie): amplification and creator seeding; the content formula works, the distribution doesn't. High views with low engagement (NARS): content strategy and format audit before any additional spend; distribution is working, the content is not triggering an affective response. High views with high engagement (e.l.f., Fenty): protect the creator relationships and content formats driving that performance, and scale what's working before experimenting.
How frequently should a makeup brand run this kind of social intelligence pull?
Quarterly is the minimum viable cadence for strategic planning; monthly is better for in-market campaign optimization; weekly is the standard for any brand actively running creator programs. TikTok trends in beauty can peak and exhaust in under two weeks -- a 90-day lookback like this one is useful for category-level strategy and budget allocation, but it will miss fast-moving moments. Real-time or near-real-time listening is required to act on trend windows before they close.
How GEN does this differently
This report is a point-in-time snapshot. GEN runs this same social intelligence layer -- video ingestion, topic clustering, brand SOV ranking, and engagement-based sentiment scoring -- continuously and in real time, across any category or brand set. For makeup marketers tracking a fast-moving space, the difference between a quarterly report and a live signal feed is the difference between reacting to trends and anticipating them.