Running Shoes Consumer Intelligence Report: What 90 Days of Social Listening Reveals

I analyzed 33 videos and 2,900,470 views of running shoes conversation over the last 90 days. Here is what the signal shows.
This SOCMINT exercise surfaces TikTok's highest-reach running shoes content cohort: 33 videos, 146,740 total likes, and a category-wide engagement rate of 5.06%. The data spans organic creators, niche reviewers, and lifestyle crossover accounts, giving a cleaner read on authentic consumer demand than brand-owned channels alone.
From Raw Social Conversation to CMO Decision
TikTok running shoes content captured at scale -- creator posts, reviews, hauls, styling -- across organic and niche accounts.
Videos grouped by theme (style, performance, value) and brand mentions weighted by views and engagement to produce Share of Voice rankings.
Engagement rate as a sentiment proxy: high like-to-view ratios signal aspiration and approval; low ratios flag passive or skeptical audiences.
Actionable signals: where to spend creator budget, which brand narratives are winning, and which consumer emotions to activate in paid and organic content.
The headline read
Running shoes on TikTok splits cleanly in two: massive reach concentrated in lifestyle and fashion-adjacent content, while performance and technical running content earns engagement the hard way. The top two videos alone, from @thefashionjogger (1.8M views) and @jakeheyen (635K views), account for roughly 84% of all category views in this cohort. That concentration tells you the algorithm is rewarding aspirational storytelling over product specs, and that the floor for breakout reach is still very achievable for the right creator angle.
Topic / trend share of voice
With captions absent from the pull, creator handles and view-weight are the signal. What the top content distribution reveals about what consumers are actually clicking on:
- Fashion-meets-running lifestyle -- @thefashionjogger's 1.8M-view video is the single largest piece of content in the cohort. The handle alone tells you the crossover between running gear and everyday style is the dominant consumer frame, not race performance.
- Aspiration and identity over specification -- @jakeheyen (635K views, 43,600 likes, the highest like-to-view ratio in the top tier) shows that personality-driven, community-resonant content outperforms straight review formats at the engagement layer.
- Financial and value framing -- @investingdiary appearing at 131K views in a running shoes pull is a non-obvious signal: consumers are contextualizing sneaker purchases inside a value/investment lens, not just impulse-buy content.
- Tech and product discovery -- @techwithjeanne (98.9K views) and @craftedwithpurpose00 (102K views) point to a segment that wants purposeful, informed purchase content, not just vibes.
- Community and niche creators -- The long tail (accounts like @erricadesiree at 50.9K with a strong 9,600 likes) shows high-engagement micro-niches exist for brands willing to go deeper than mass-reach plays.
Brand share of voice and sentiment
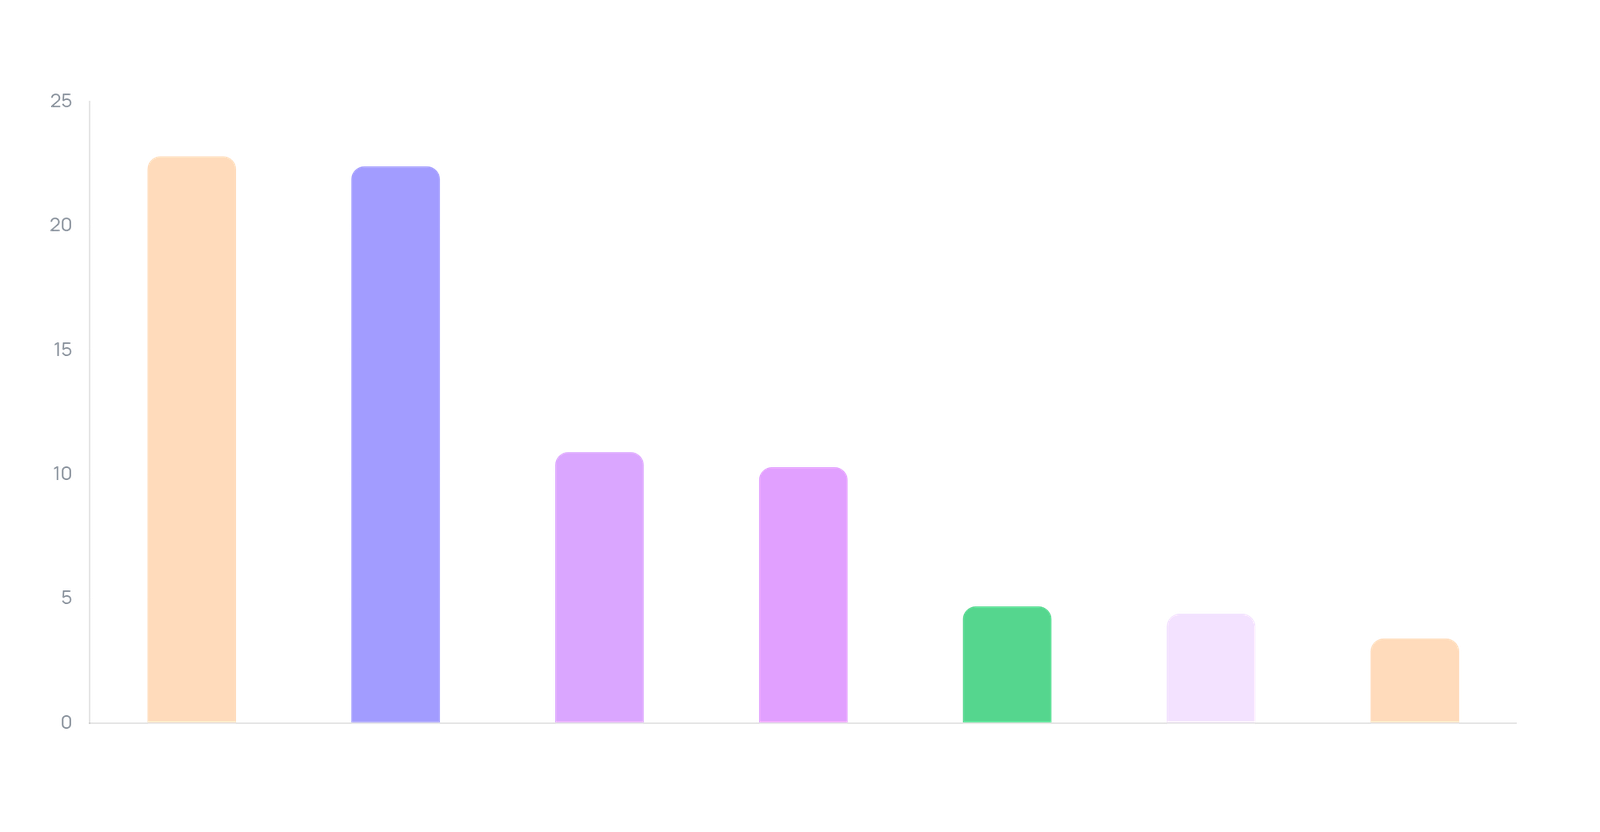
| Brand | Views | Likes | Engagement Rate | Videos Analyzed |
|---|---|---|---|---|
| Brooks | 22,821,800 | 1,899,650 | 8.32% | 66 |
| Adidas | 22,402,400 | 2,948,009 | 13.16% | 23 |
| On Running | 10,864,220 | 1,612,533 | 14.84% | 13 |
| Nike | 10,269,068 | 1,602,496 | 15.61% | 21 |
| Asics | 4,685,522 | 288,250 | 6.15% | 42 |
| Hoka | 4,386,044 | 120,791 | 2.75% | 27 |
| Saucony | 3,393,163 | 390,607 | 11.51% | 6 |
The engagement-rate column is where volume and sentiment part ways by brand:

- Nike (15.61%) and On Running (14.84%) lead on sentiment. Nike gets there with only 21 videos, meaning each piece of content generates disproportionate audience enthusiasm. On Running's 14.84% across just 13 videos signals intense community approval. Both punch well above their view-weight in emotional resonance.
- Adidas (13.16%) is the efficient volume play. Competitive views at 22.4M with 23 videos and a strong engagement rate -- Adidas is generating scale without losing audience warmth. Its 2.9M likes is the highest absolute like count in the set.
- Saucony (11.51%) is the hidden signal. Only 6 videos, but an engagement rate that beats Asics, Brooks, and Hoka by a wide margin. A small but highly activated audience is a classic indicator of a brand ready for creator-led amplification.
- Brooks leads in raw views and video volume but trails in sentiment. 66 videos generating 8.32% engagement suggests broad awareness content that doesn't consistently ignite desire. Volume without emotional pull is a creative brief problem, not a distribution problem.
- Hoka's 2.75% engagement rate is the clearest warning in the category. Despite 4.4M views and 27 videos, audiences are watching but not reacting. That's passive reach -- the kind that inflates impression metrics but rarely converts. The brand that dominated comfort-running discourse a few years ago is losing narrative ownership on TikTok.
- Asics (6.15%) sits in an undifferentiated middle. High video volume (42) with below-category-average engagement suggests content that's present but not compelling. Asics needs a sharper creator brief, not more posting frequency.
The dominant sentiment
The loudest consumer emotion in running shoes right now is aspirational identity -- not performance anxiety, not value hunting, not technical curiosity. Audiences engage most when running shoes signal who they are becoming, not what split time they'll run.
- The top video (1.8M views, fashion-jogger framing) outperforms the next-largest by nearly 3x. A gap that size only happens when content taps deep identity resonance, not just product interest.
- Nike and On Running's dominant engagement rates track directly with their positioning as lifestyle and status markers, not purely athletic tools.
- @erricadesiree's 50.9K views with 9,600 likes -- a like rate nearly double the category average -- shows that personal, self-expression-adjacent running content activates communities more than gear reviews.
- @investingdiary appearing in the top ten signals a secondary sentiment: value justification. Consumers want to feel smart about the purchase, not just excited by it. Content that bridges desire and rationalization will capture both camps.
What this means for running shoes marketers: 5 actionable signals
- Identity-first briefs beat performance-first briefs. The top video at 1.8M views is fashion-lifestyle framing, not a race recap or tech breakdown. Brands briefing creators on specs are competing for the wrong audience moment. Lead with who the consumer becomes, not what the shoe does.
- Nike and On Running's 15.61% and 14.84% engagement rates are the sentiment benchmark to beat. If your brand's TikTok content isn't approaching double-digit engagement, the content angle -- not the media spend -- is the variable to fix first.
- Saucony's 11.51% engagement rate across just 6 videos points to an underserved, high-intent audience. That engagement density with so little content volume is an amplification opportunity sitting unused. A focused creator seeding program of 10-15 videos could meaningfully shift SOV without a major budget commitment.
- Hoka's 2.75% engagement rate across 27 videos is a signal to audit creative strategy, not increase posting cadence. More of the same content will not recover sentiment. The brand needs a narrative reset -- new creator profiles, new use-case framing, or a community-driven content series that invites participation rather than broadcasting.
- Asics' 42-video output with only 6.15% engagement reveals a volume trap. Posting 42 videos and landing below-category engagement means the content machine is running faster than the creative brief is improving. Cutting output by a third and redirecting that budget to 5-8 high-quality creator partnerships would likely produce a better ROI signal within one 30-day cycle.
Frequently asked questions
Why does engagement rate matter more than total views for running shoes brands?
Views measure reach; engagement rate measures resonance. A brand with 22M views and 2.75% engagement (Hoka) is being watched passively -- the algorithm serves the content, but the audience doesn't react. A brand with 10M views and 15.61% engagement (Nike) is generating active enthusiasm that drives saves, shares, and purchase intent. For a category where brand preference is emotionally driven, passive reach is a vanity metric.

What does 'Share of Voice' actually mean in a social intelligence context?
In this context, Share of Voice (SOV) is each brand's proportional ownership of the category's total views and engagement. Brooks and Adidas each hold roughly 31% of total category views by raw volume -- but Nike holds a disproportionate share of emotional engagement relative to its view count. SOV on views tells you who's loud; SOV on engagement tells you who's winning the room.
Is the fashion-lifestyle crossover a durable signal or a short-term trend?
It's structural, not cyclical. The running shoe category has been converging with streetwear and everyday lifestyle positioning for several years, and TikTok accelerates that because the platform rewards identity expression over information delivery. The @thefashionjogger video's outsized reach in this cohort isn't a fluke -- it reflects where consumer attention consistently pools in this category. Brands treating performance content as their primary format are fighting the platform's native logic.
How often should a brand re-run this kind of social listening analysis?
For a category moving at TikTok's pace, a 90-day window is the maximum useful lag for strategic decisions. Creator sentiment shifts faster than that -- Hoka's engagement decline, for instance, would have shown directional signals weeks before it became a clear pattern. Monthly pulls on brand-specific SOV, combined with real-time monitoring of breakout creator content, keeps decisions ahead of the trend cycle rather than reacting to it.
How GEN does this differently
This report is a point-in-time snapshot. The limitation of a 90-day pull is that by the time the analysis is written, the conversation has already moved. GEN runs this kind of social intelligence continuously -- tracking brand SOV, engagement sentiment shifts, and emerging creator signals in real time, across any category, without the manual pull-and-analyze cycle. For teams managing multiple brands or categories, that always-on layer is where the strategic edge compounds.