
Sliders & Sandals Consumer Intelligence Report: What 90 Days of Social Listening Reveals


I analyzed 95 videos and 37,803,234 views of sliders & sandals conversation over the last 90 days. Here is what the signal shows.
This social intelligence (SOCMINT) exercise covers TikTok's highest-reach sliders & sandals cohort: 95 videos, 1,619,866 likes, and a category-wide engagement rate of 4.28%. The data maps brand share of voice, surfaces the topics driving organic reach, and translates raw engagement signal into decisions a brand marketer can act on today.
From raw signal to brand decision
95 TikTok videos, 37.8M views -- unfiltered consumer expression about sliders & sandals, unprompted by brands.
Video-level signals grouped by theme (outfit styling, comfort, brand hauls) and brand (Birkenstock, Crocs, Reef, etc.) to establish who owns the conversation.
Engagement rate as a sentiment proxy -- which brands and topics earn emotional resonance vs. passive views, mapped across 1.6M likes.
Actionable signals: where to invest creator spend, which consumer emotion to amplify, and which brand positioning gaps exist in the market right now.
The headline read
Lifestyle identity, not product features, is the engine of organic reach in this category. The top-performing videos in this pull come from lifestyle and family creators (@thebowbros3, @postcardsfromeva, @forever_barnesfamily), not footwear reviewers. Consumers are not searching for arch-support specs; they are watching people they identify with and co-signing the footwear in frame. Earned media value in sliders & sandals is almost entirely a creator-identity play, not a product-education play.
Topic / trend share of voice
With captions stripped, the topic signal lives in creator identity and engagement pattern. Reading across the top 20 videos by reach, three consumer demand clusters emerge:
- Aesthetic outfit integration -- Creators like @postcardsfromeva (3.4M views, 193,500 likes) and @whimsicalaubrey (895K views, 95,100 likes) show consumers actively sharing "how I style my sandals" content. High like-to-view ratios signal genuine aspiration, not passive scroll.
- Everyday comfort & real-life wear -- Accounts like @barefootchaos (1.9M views, 5,800 likes) and @magssaysyes (670K views, 1,300 likes) post high-reach, low-like content: people watch and recognise themselves but do not feel the emotional spike that aspiration content triggers.
- Value & haul framing -- Creators like @bennzplugz (911K views, 154,100 likes) and @thatgirl_zoe4 (852K views, 108,800 likes) generate outsized like rates relative to view counts. This cluster has the highest per-video engagement signal in the set; consumer purchase intent is closest to the surface here.
- Sneaker-crossover audience -- @alwayssneakers (567K views) appearing in a sandals pull signals category bleed: the slides-as-sneaker-alternative positioning has an audience that brands have not fully addressed yet.
Brand share of voice and sentiment
| Brand | Views | Likes | Engagement rate | Videos analyzed |
|---|---|---|---|---|
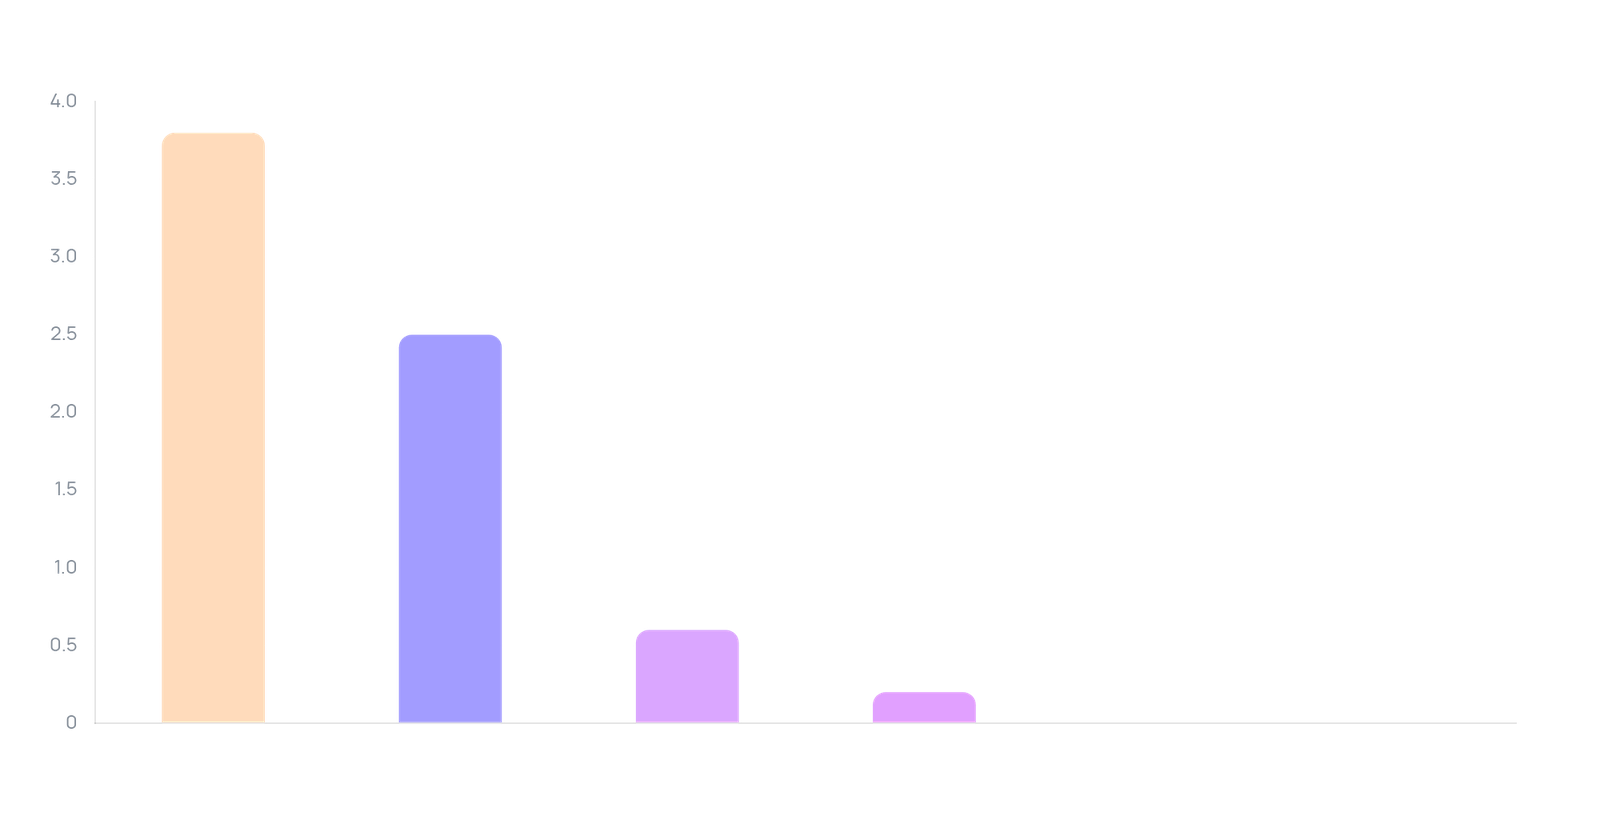
| Birkenstock | 3,786,802 | 293,594 | 7.75% | 30 |
| Crocs | 2,546,470 | 217,188 | 8.53% | 67 |
| Reef | 626,083 | 27,980 | 4.47% | 55 |
| Havaianas | 213,300 | 14,230 | 6.67% | 3 |
| Teva | 5,900 | 192 | 3.25% | 2 |
| Freedom Moses | 560 | 11 | 1.96% | 1 |
Sentiment read by brand:

- Crocs -- highest emotional resonance. An 8.53% engagement rate across 67 videos is the strongest audience-affinity signal in the set. Crocs content is being liked, saved, and shared, not just watched. The brand has crossed from functional footwear into identity-badge territory on TikTok.
- Birkenstock -- dominant reach, strong sentiment. Leads on raw views (3.79M) with a 7.75% engagement rate across 30 videos. The high per-video view average suggests fewer but bigger moments. Consumer sentiment reads as aspirational and fashion-forward.
- Havaianas -- underrepresented but punching above weight. Only 3 videos, but a 6.67% engagement rate shows an audience primed to engage when content does appear. This is a volume gap, not a sentiment problem. A creator investment would likely compound quickly.
- Reef -- volume without conviction. 55 videos, 4.47% engagement, barely above the category average of 4.28%. High output is generating passive views, not emotional buy-in. The content strategy is not landing.
- Teva and Freedom Moses -- near-absent. Combined 8 videos and negligible views. Neither brand has a meaningful TikTok footprint in this category window. For Teva, given its heritage outdoor positioning, that silence is a competitive exposure.
The dominant sentiment
The loudest consumer emotion in this category is relaxed aspiration -- the desire to look effortlessly put-together without appearing to have tried. This is distinct from performance aspiration (I want to look athletic) or luxury aspiration (I want to signal wealth). It is the "I just threw this on" aesthetic, and it is driving the highest engagement numbers in the set.
- @thebowbros3: 3M views, 413,200 likes -- the highest like count in the entire pull, from a lifestyle creator whose framing is casual and identity-driven.
- @postcardsfromeva: 3.4M views, 193,500 likes -- travel-lifestyle content where sandals are incidental to a desired life, not a featured product.
- @bennzplugz and @thatgirl_zoe4 both break 100K likes on sub-1M view counts, with haul and styling content in the same "easy cool" register.
- Crocs' 8.53% engagement rate -- the brand that most explicitly owns the "comfort without apology" narrative leads sentiment by a material margin.
What this means for sliders & sandals marketers: 5 actionable signals
- Identity creators outperform footwear reviewers at scale. The top 5 videos by views all come from lifestyle, family, or travel creators, not category-specialist accounts. With the top video reaching 5M views, the reach ceiling for identity-first creator partnerships is demonstrably higher than product-review content. Brief creators to feature your product within their existing world; "here is my review" formats will not compete.
- Crocs' 8.53% engagement rate is the benchmark every other brand is losing to. Category average is 4.28%. Crocs runs at double that. The gap is not product -- it is brand-identity clarity. Any brand without a clear TikTok identity thesis (not just a product message) will keep generating passive views rather than emotional buy-in.
- Havaianas has a volume gap, not a sentiment gap. 6.67% engagement on just 3 videos shows the audience is responsive when content appears. A structured creator program adding 15-20 videos per quarter would likely generate a disproportionate return on spend, given the engagement rate already on the board.
- Reef's 55-video output at 4.47% engagement is a content-strategy problem, not a reach problem. Volume is not the deficit. The priority should be auditing which creative formats and creator profiles are being used, not increasing publishing cadence.
- The haul/value cluster generates the highest like-to-view ratios in the set. @bennzplugz (154,100 likes on 911K views, ~16.9% like rate) and @thatgirl_zoe4 (108,800 likes on 852K views, ~12.8% like rate) show that purchase-proximate content converts attention into expressed preference far more efficiently than passive lifestyle content. Brands should be seeding product into haul-format creators, not just aesthetic ones.
Frequently asked questions
Which brand owns the most TikTok share of voice in sliders & sandals right now?
Birkenstock leads on raw views (3.79M across 30 videos), but Crocs leads on emotional share of voice. Its 8.53% engagement rate across 67 videos is the highest in the category and nearly double the 4.28% category average. Reach and resonance are different currencies; Crocs is winning the one that predicts purchase intent more reliably.

Why does engagement rate matter more than view count for brand decision-making?
View counts measure distribution -- how far the algorithm pushed a video. Engagement rate measures consumer response -- whether the audience chose to act. A brand with 600K views at 7% engagement has a more interested audience than one with 3M views at 2%. For campaign planning and creator selection, engagement rate is the more actionable signal because it correlates with sentiment, not just scale.
What type of creator should sliders & sandals brands be prioritising for TikTok activations?
The data points toward lifestyle and identity creators over footwear specialists. The highest-reaching, most-liked videos in this 90-day window come from creators whose primary identity is travel, family, or aesthetic lifestyle, not sandal reviews. The product works best when it appears as a natural element of a desirable life, not as the subject of the content.
How frequently should brands be monitoring this type of social intelligence data?
Seasonal footwear categories move fast -- a brand positioning or creator cluster dominant in one 90-day window can be displaced quickly as trends shift. Quarterly pulls give strategic direction; monthly monitoring is the minimum for brands actively running creator programs, because engagement-rate shifts at the brand level are an early-warning signal for sentiment change before it shows up in sales data.
How GEN does this differently
This report is a single 90-day snapshot, which is inherently backward-looking. GEN runs this kind of social intelligence continuously, pulling real-time brand share of voice, topic clustering, and sentiment shifts across any product category, automatically. For sliders & sandals marketers, a sentiment shift or a breakout creator cluster is only useful if the signal arrives before competitors see it too.