SMA builds AI mirrors of your real customers from thousands of social creators — then asks them what they'd buy. Peer-reviewed science, proven across dozens of studies against real post-launch sales.
Talk to us →Consumer brands face limited historical signal, high feature dimensionality, and shifting preferences. Buyer heuristics and small focus groups struggle to generalize — resulting in inventory misallocation and preventable markdown costs.
SMA creates psychological mirrors of influencers to predict their audiences' behaviors. The influencer becomes a proxy for the consumer segment.
100+ data points per influencer across visual, audio, textual, and behavioral dimensions. From facial expressions to posting behavior.
Each mirror runs through a proprietary, patent-pending validation layer so only predictors that hold up against real-world signal make it into the panel. Data science meets human psychology.
From data ingestion to predictive inference — each step builds on peer-reviewed methodology.
Thousands of influencers across TikTok, Instagram, YouTube, and Reddit.
100+ data points per influencer across visual, audio, textual, and behavioral dimensions.
Multimodal signal is fused into comprehensive psychological profiles for every creator.
AI personas that authentically represent real consumer segments.
A patent-pending validation layer tunes each mirror against real-world signal before it joins the panel.
Probabilistic rankings with confidence intervals across every option in the study.
Proprietary mechanisms incorporate feedback and expand accuracy over time.
85-92% accuracy predicting psychological traits from digital content using transformer-based models.
AI-generated personas match human survey responses with 85% accuracy and 98% behavioral correlation.
Strong correlations between influencer preferences and audience purchasing patterns.
Synthetic-audience platforms are a crowded space. Three things separate what we do from the rest of the field.
Our synthetic audiences are built on a proprietary, patent-pending approach that keeps responses grounded in real-world signal — not just plausible-sounding LLM output.
We extract over 100 distinct data points from every video a creator posts — visual, linguistic, behavioral, audience reaction. Competitors typically work from a handful of profile fields. More signal in means tighter personas out.
The question matters as much as the panel. Our elicitation prompts are designed with category-specific marketing and research expertise so synthetic respondents are asked the way real customers think — not the way an LLM defaults to answering.
Every engagement is scoped to a specific decision — across product development and marketing. Each runs against the full panel and lands as a structured report in 3–7 days.
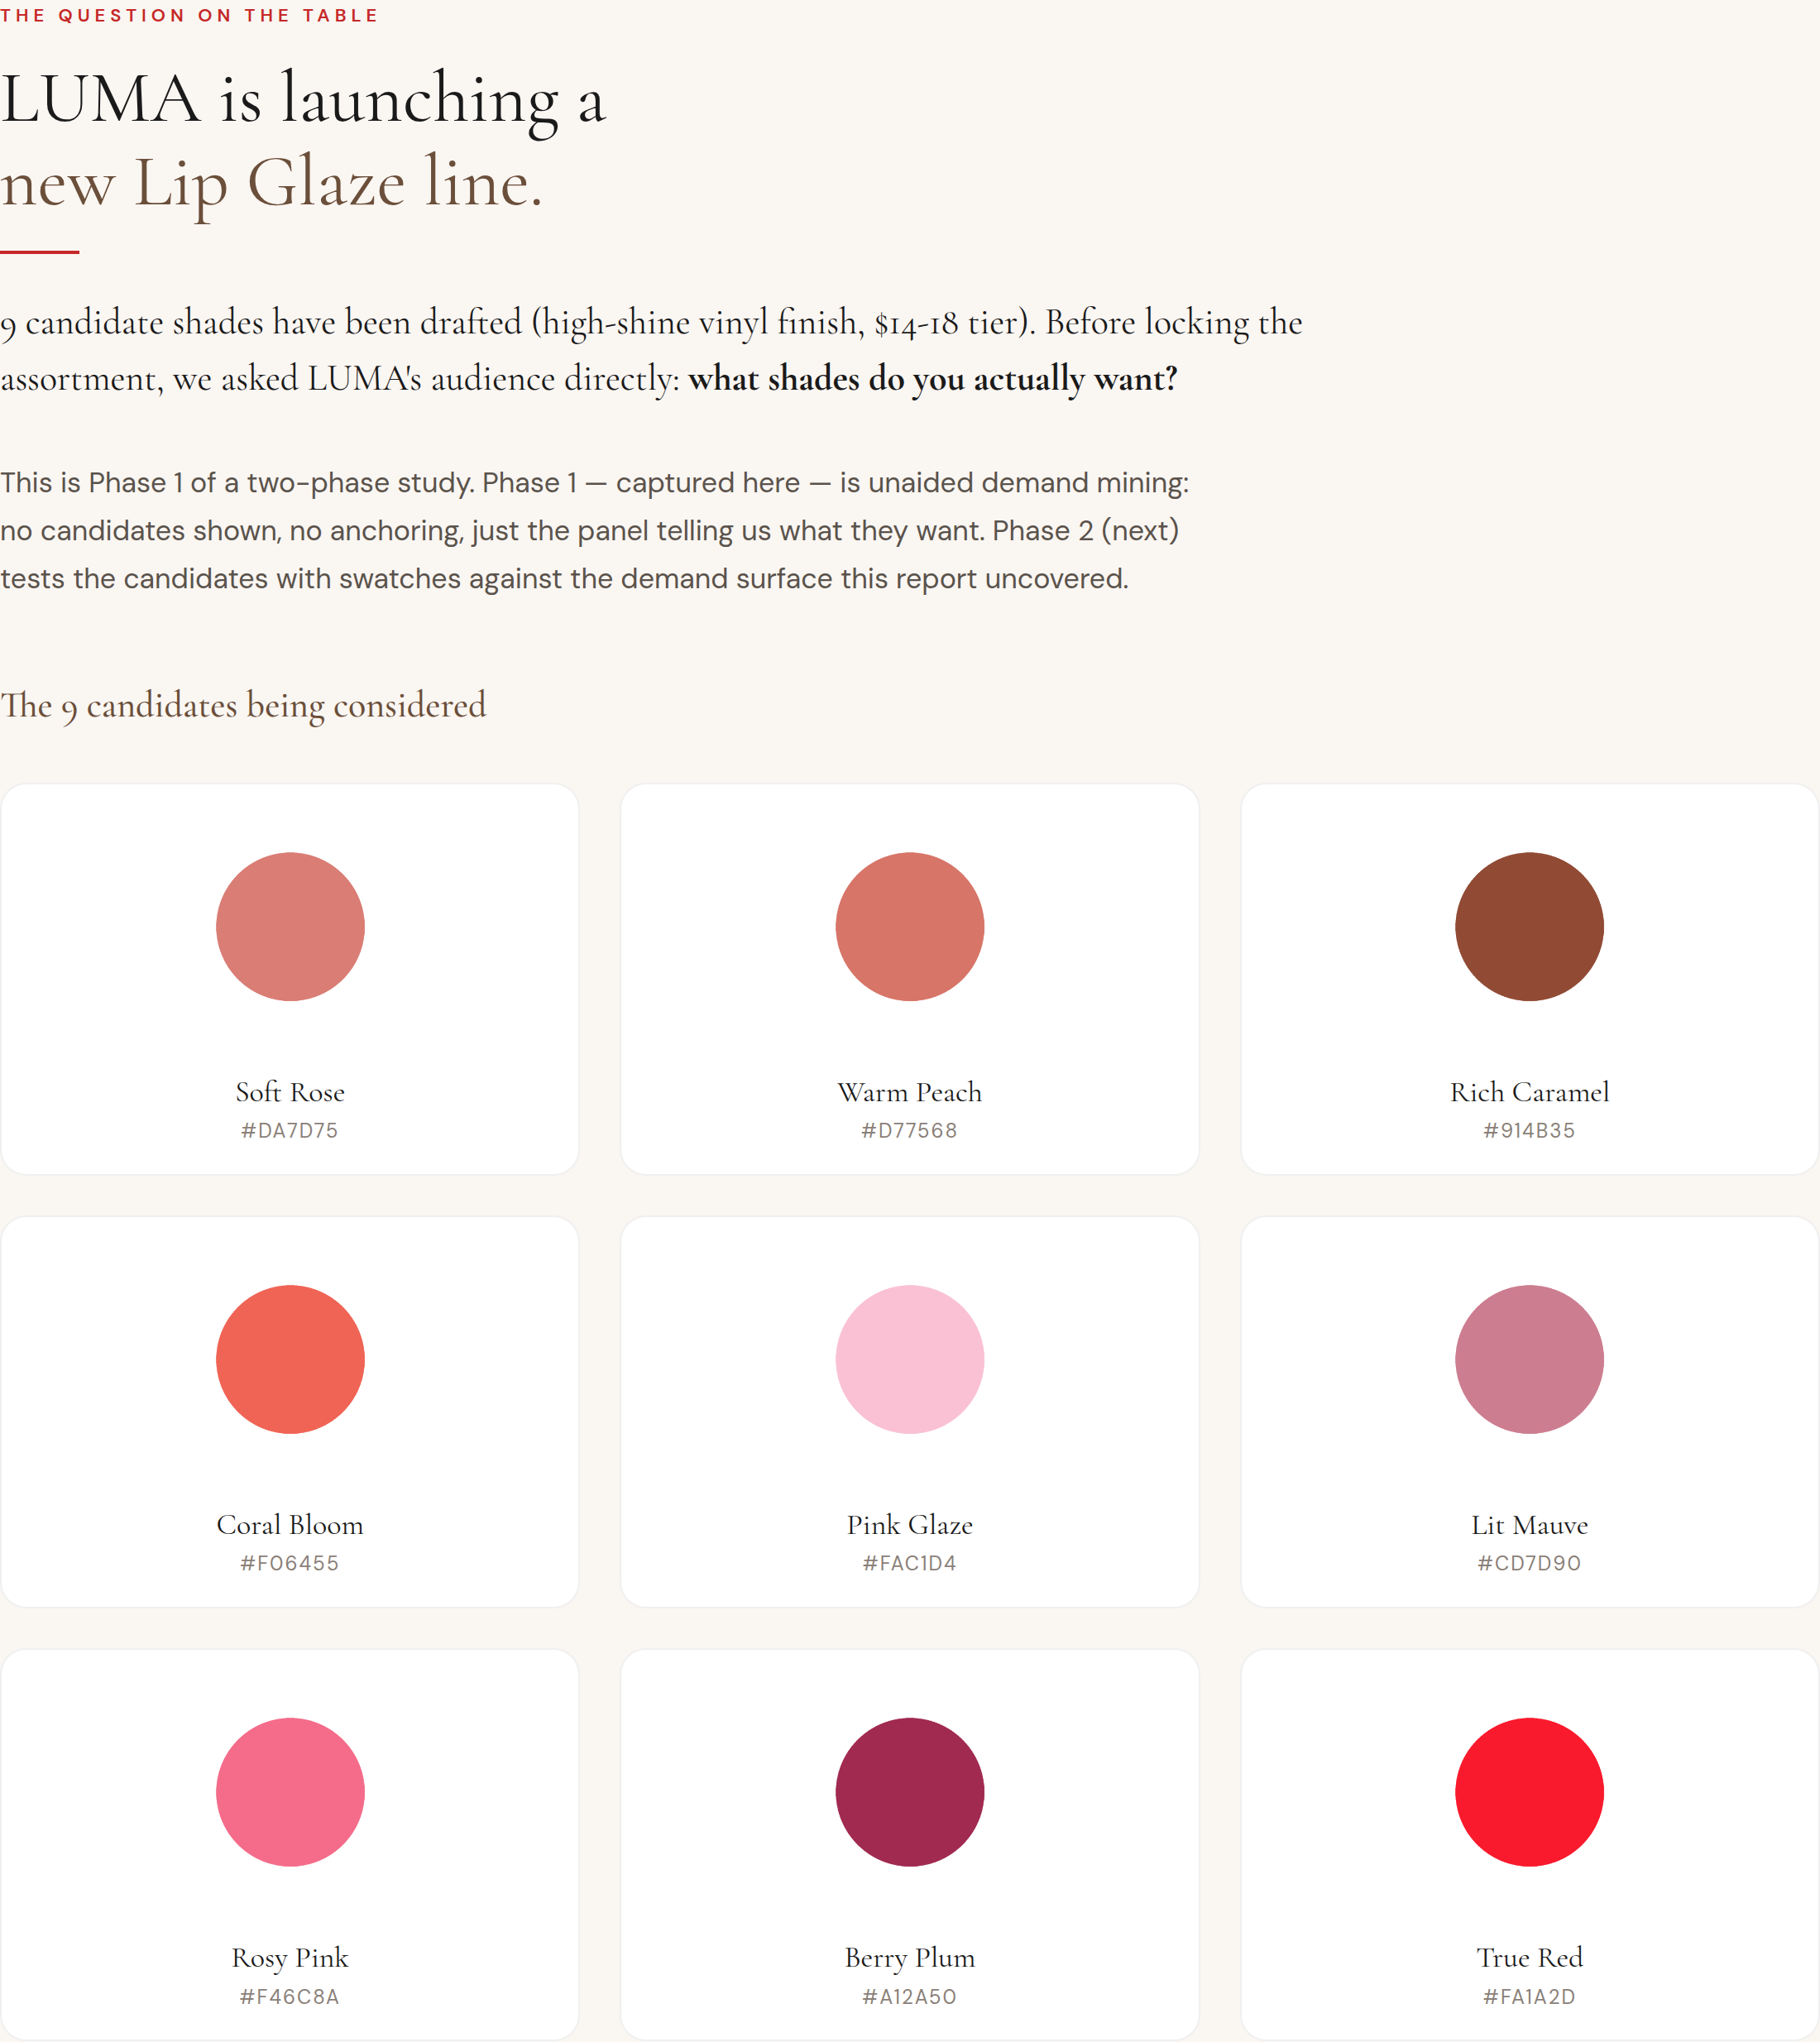
Which variants pull their weight — SKUs, tiers, or offerings. Two-phase: open-ended demand mining, then forced-choice head-to-head. Output: ranked preference share + drop/keep guidance.
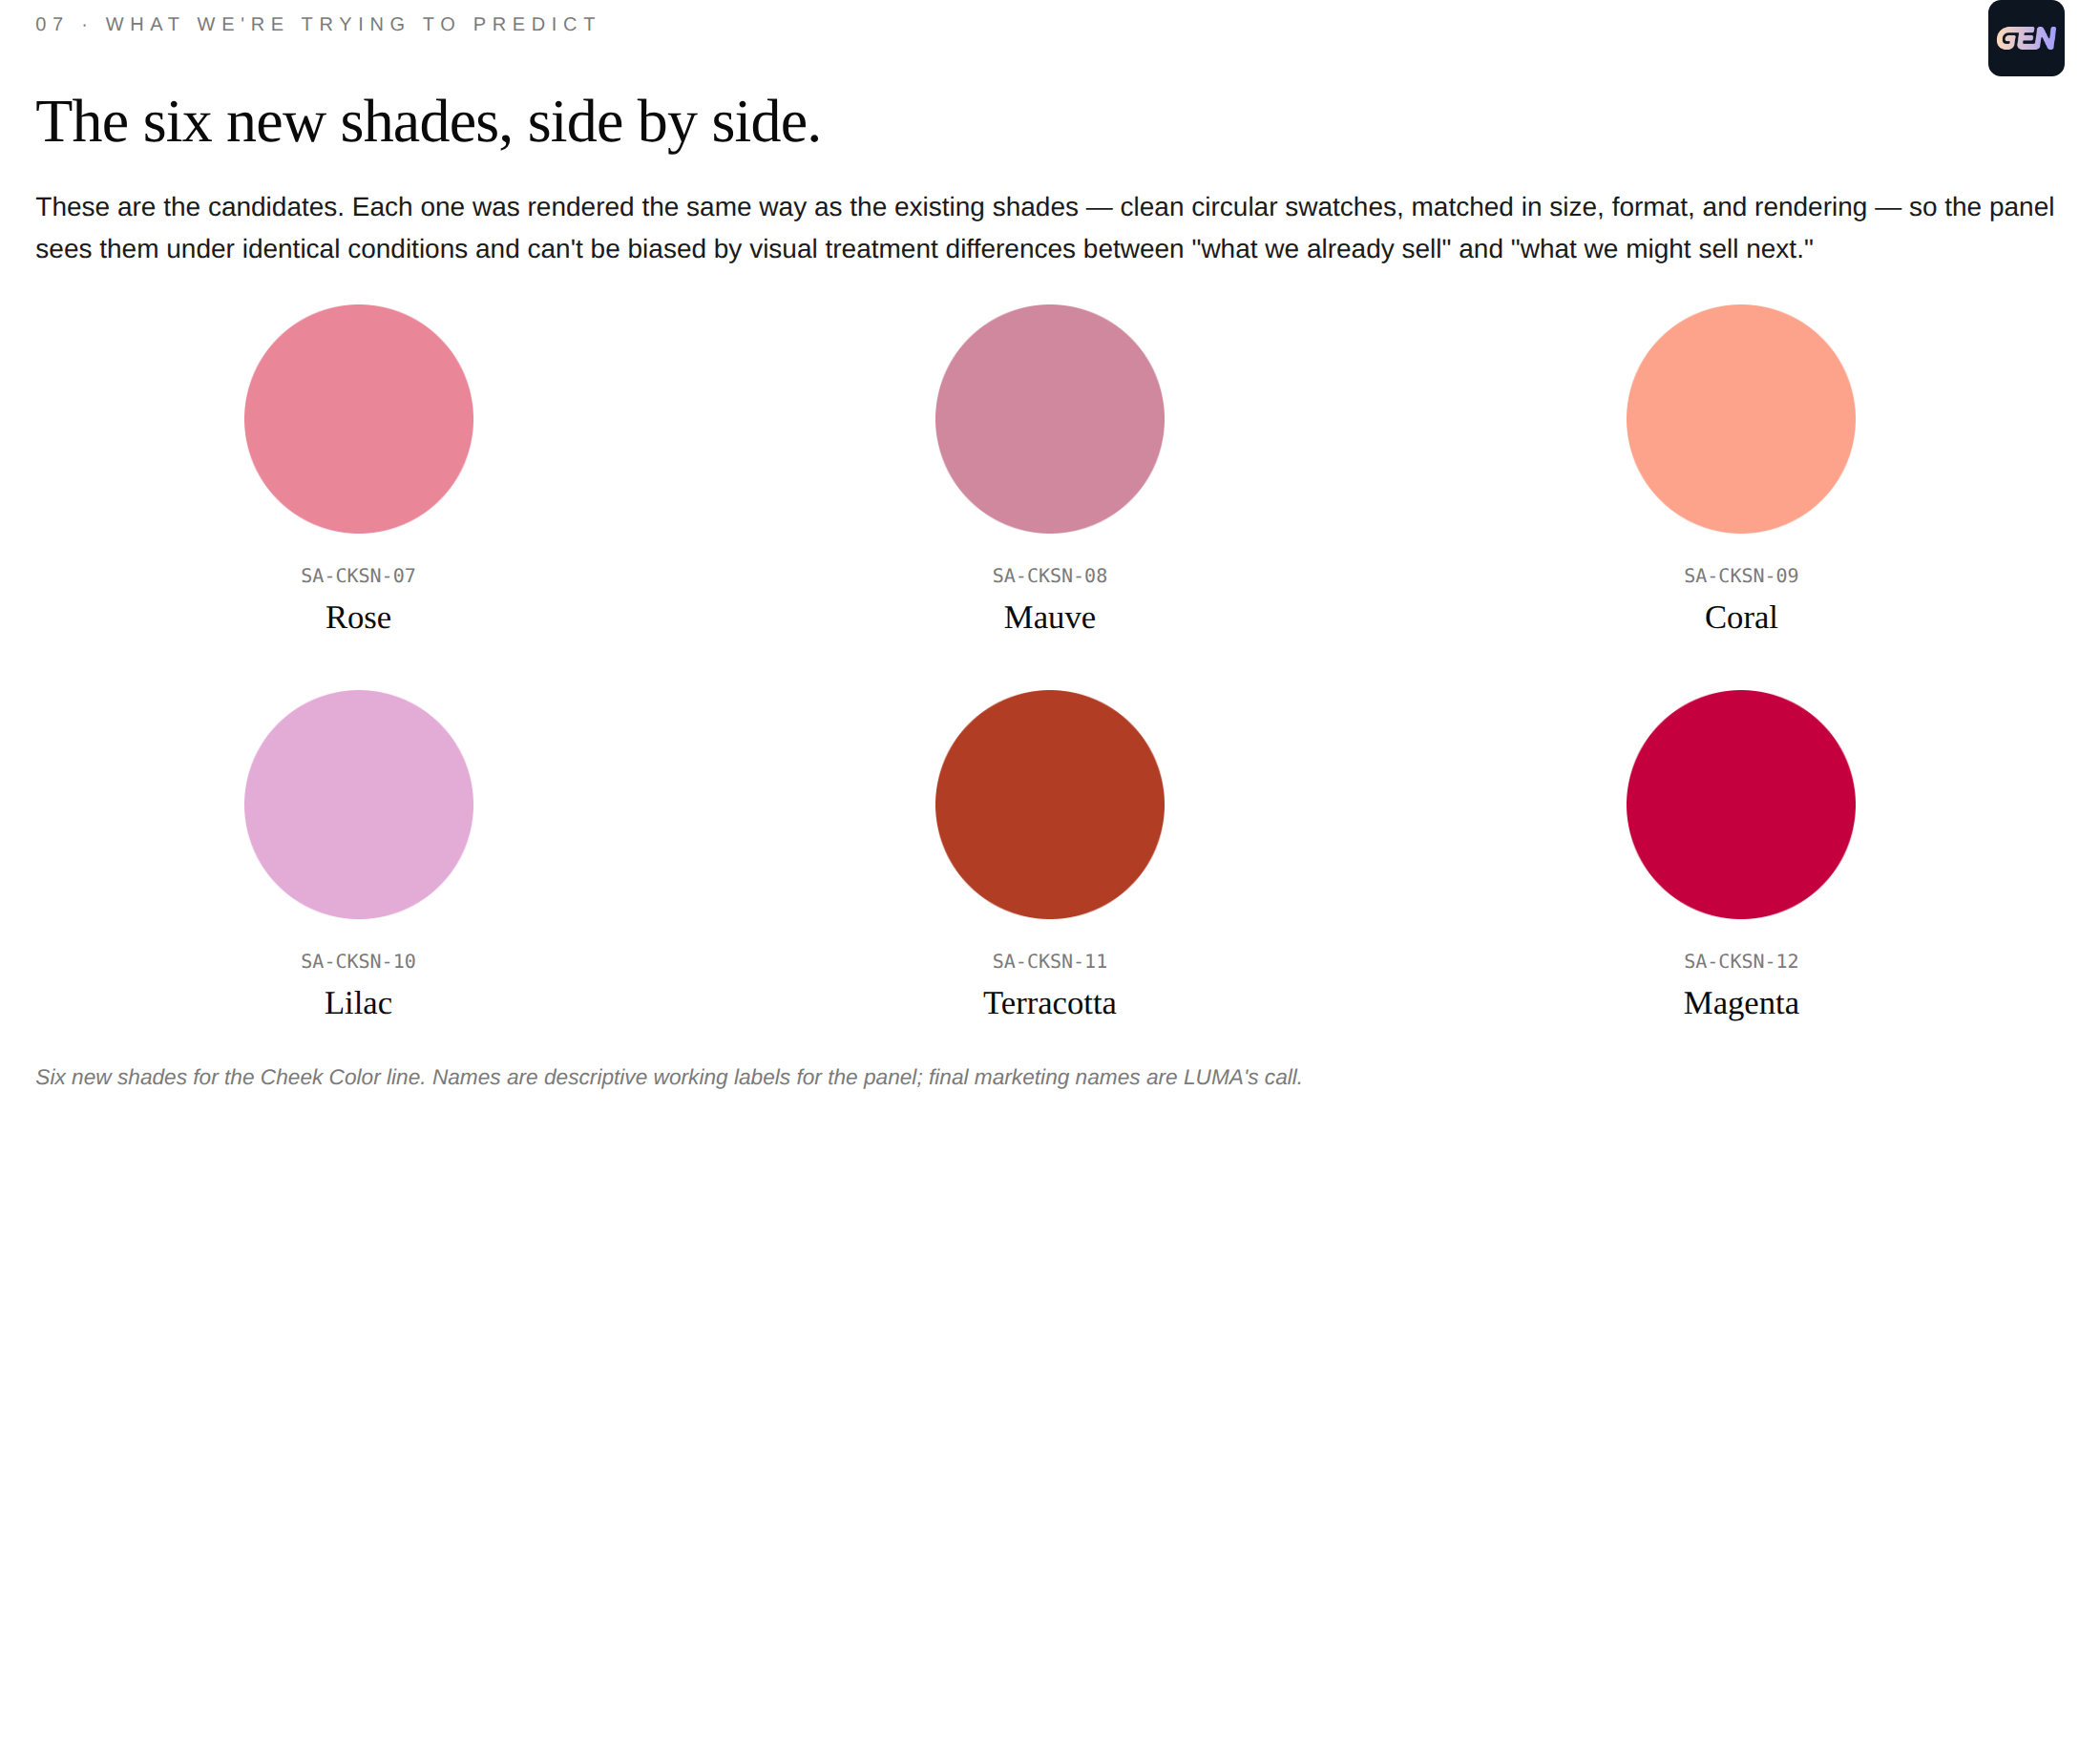
See the proposed range the way a customer would — every option in one view, ranked, before a single unit is produced.
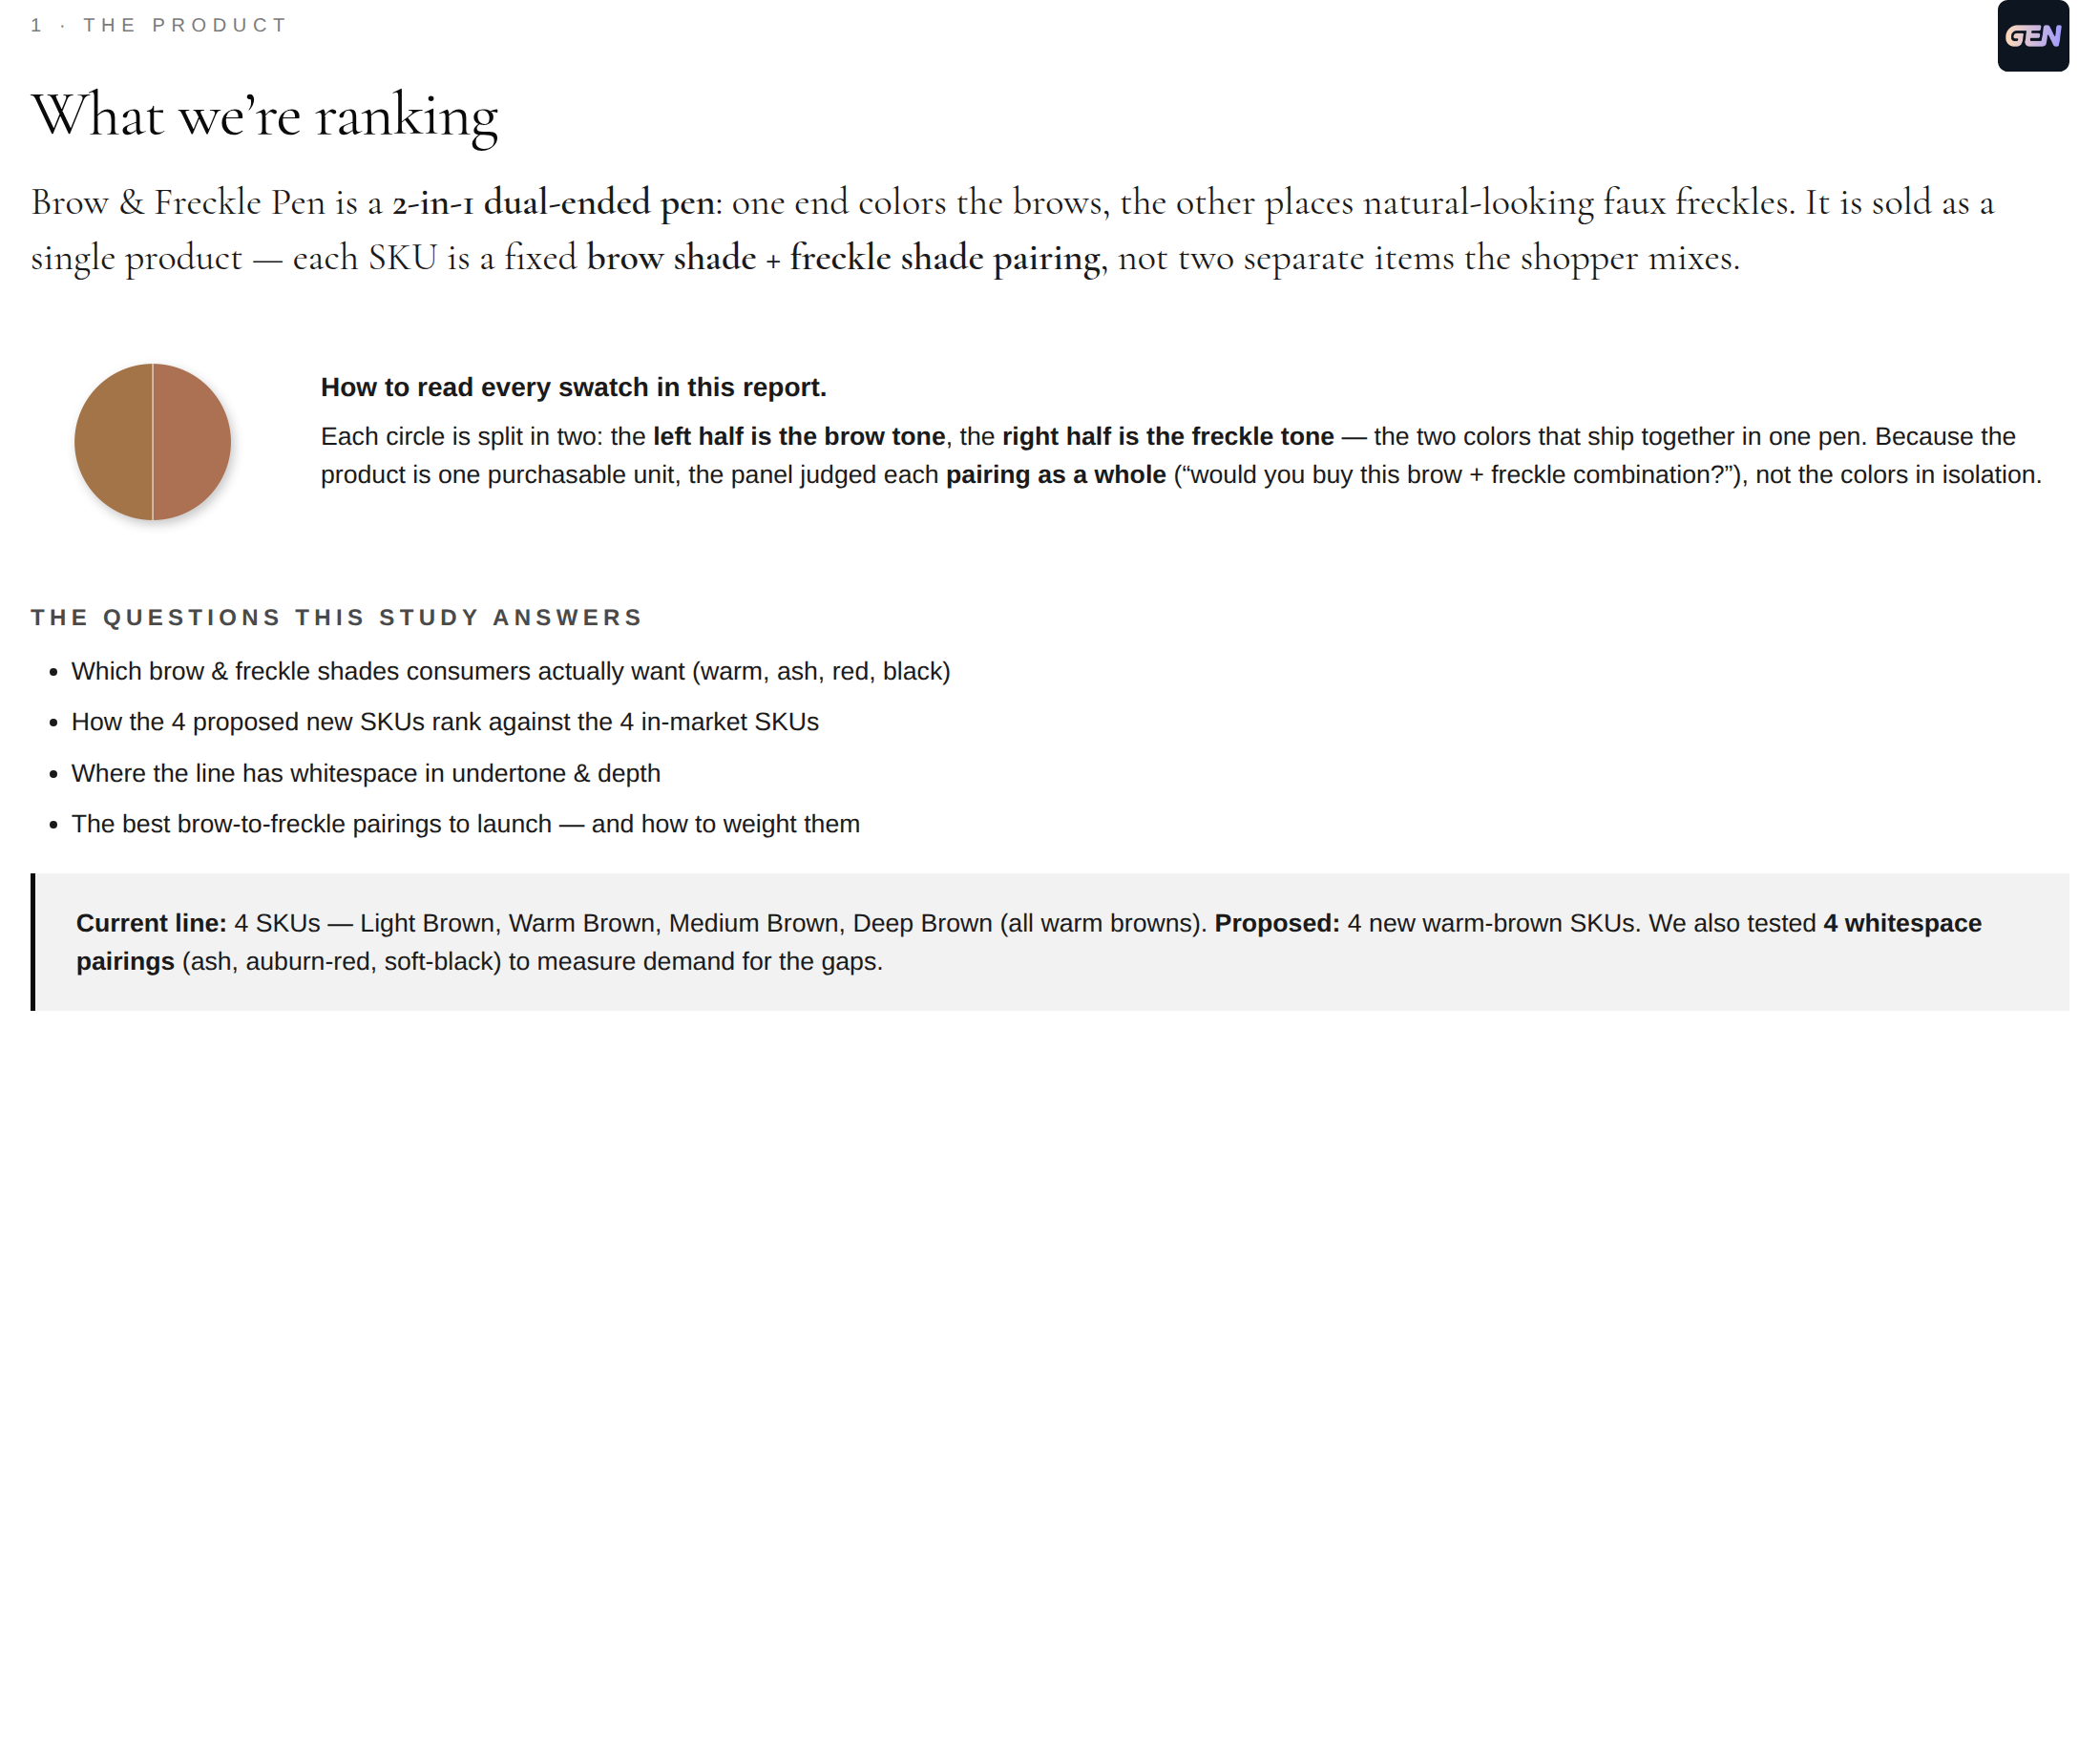
Test a novel format — 2-in-1, bundle, multi-use — evaluated as a whole product, not just a single shade. Proof the method handles new formats.
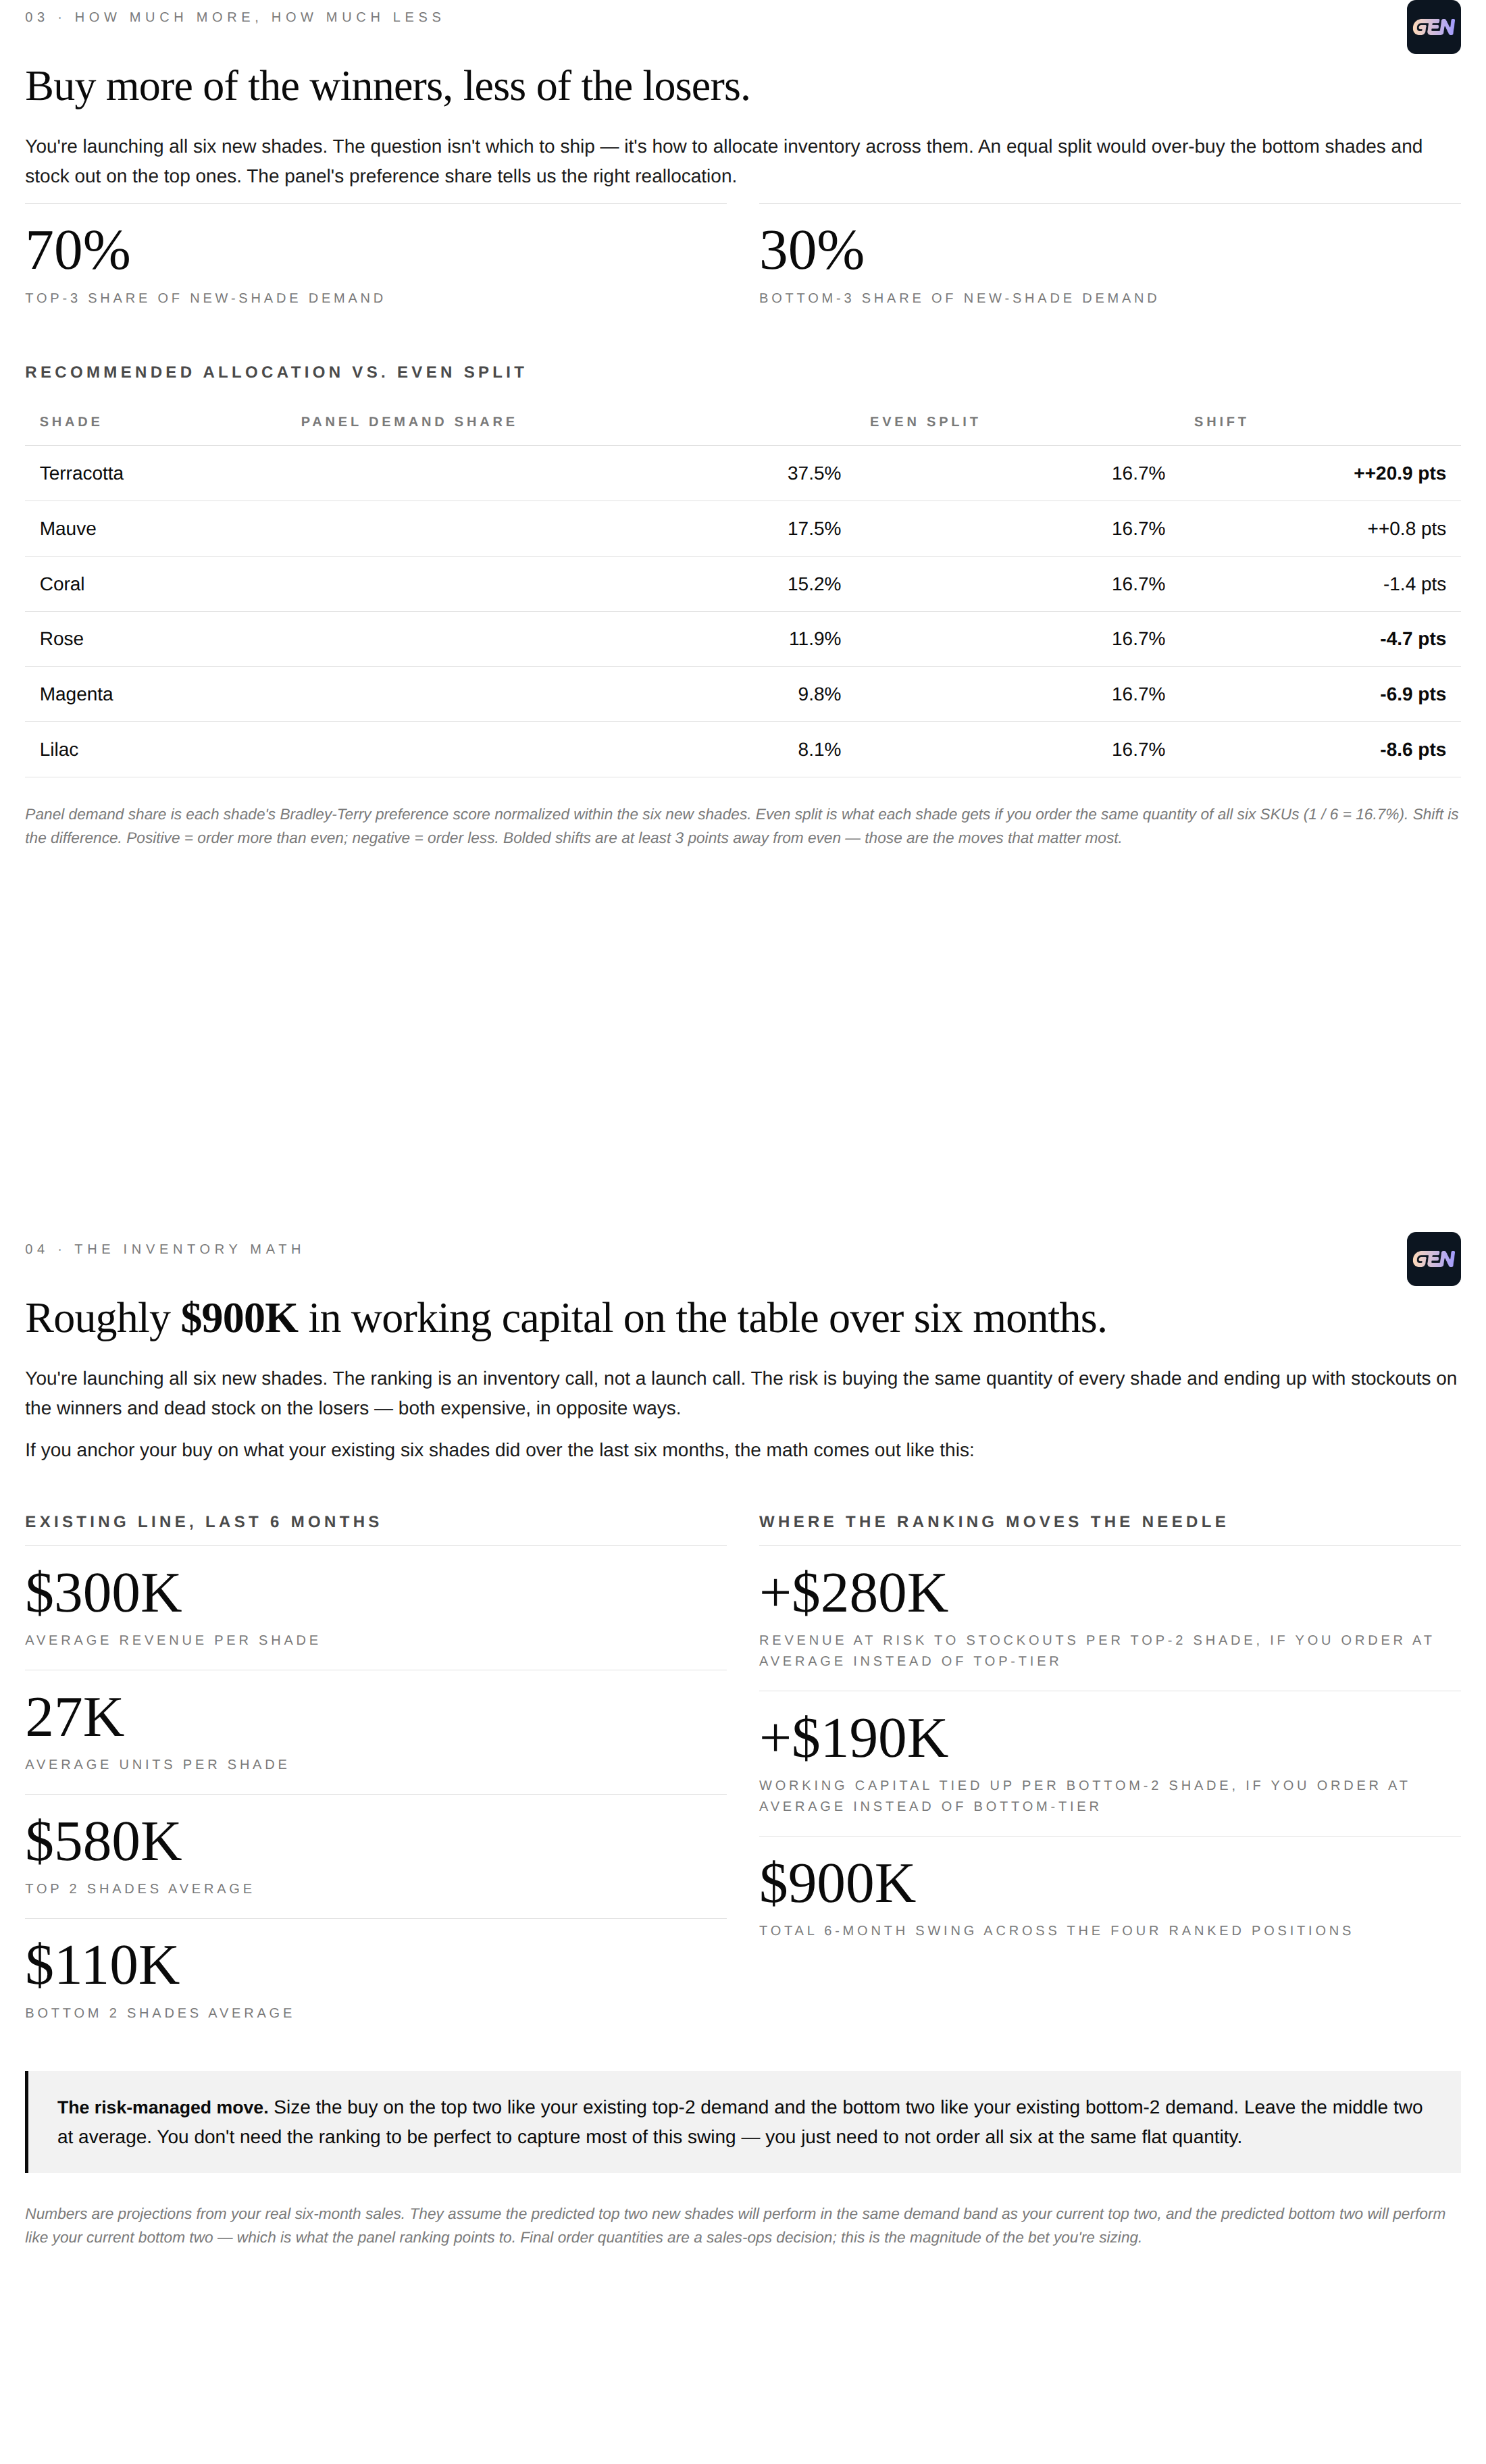
Turn predicted demand share into a buy: order more of the winners, less of the rest. The production-risk decision, quantified before you commit.
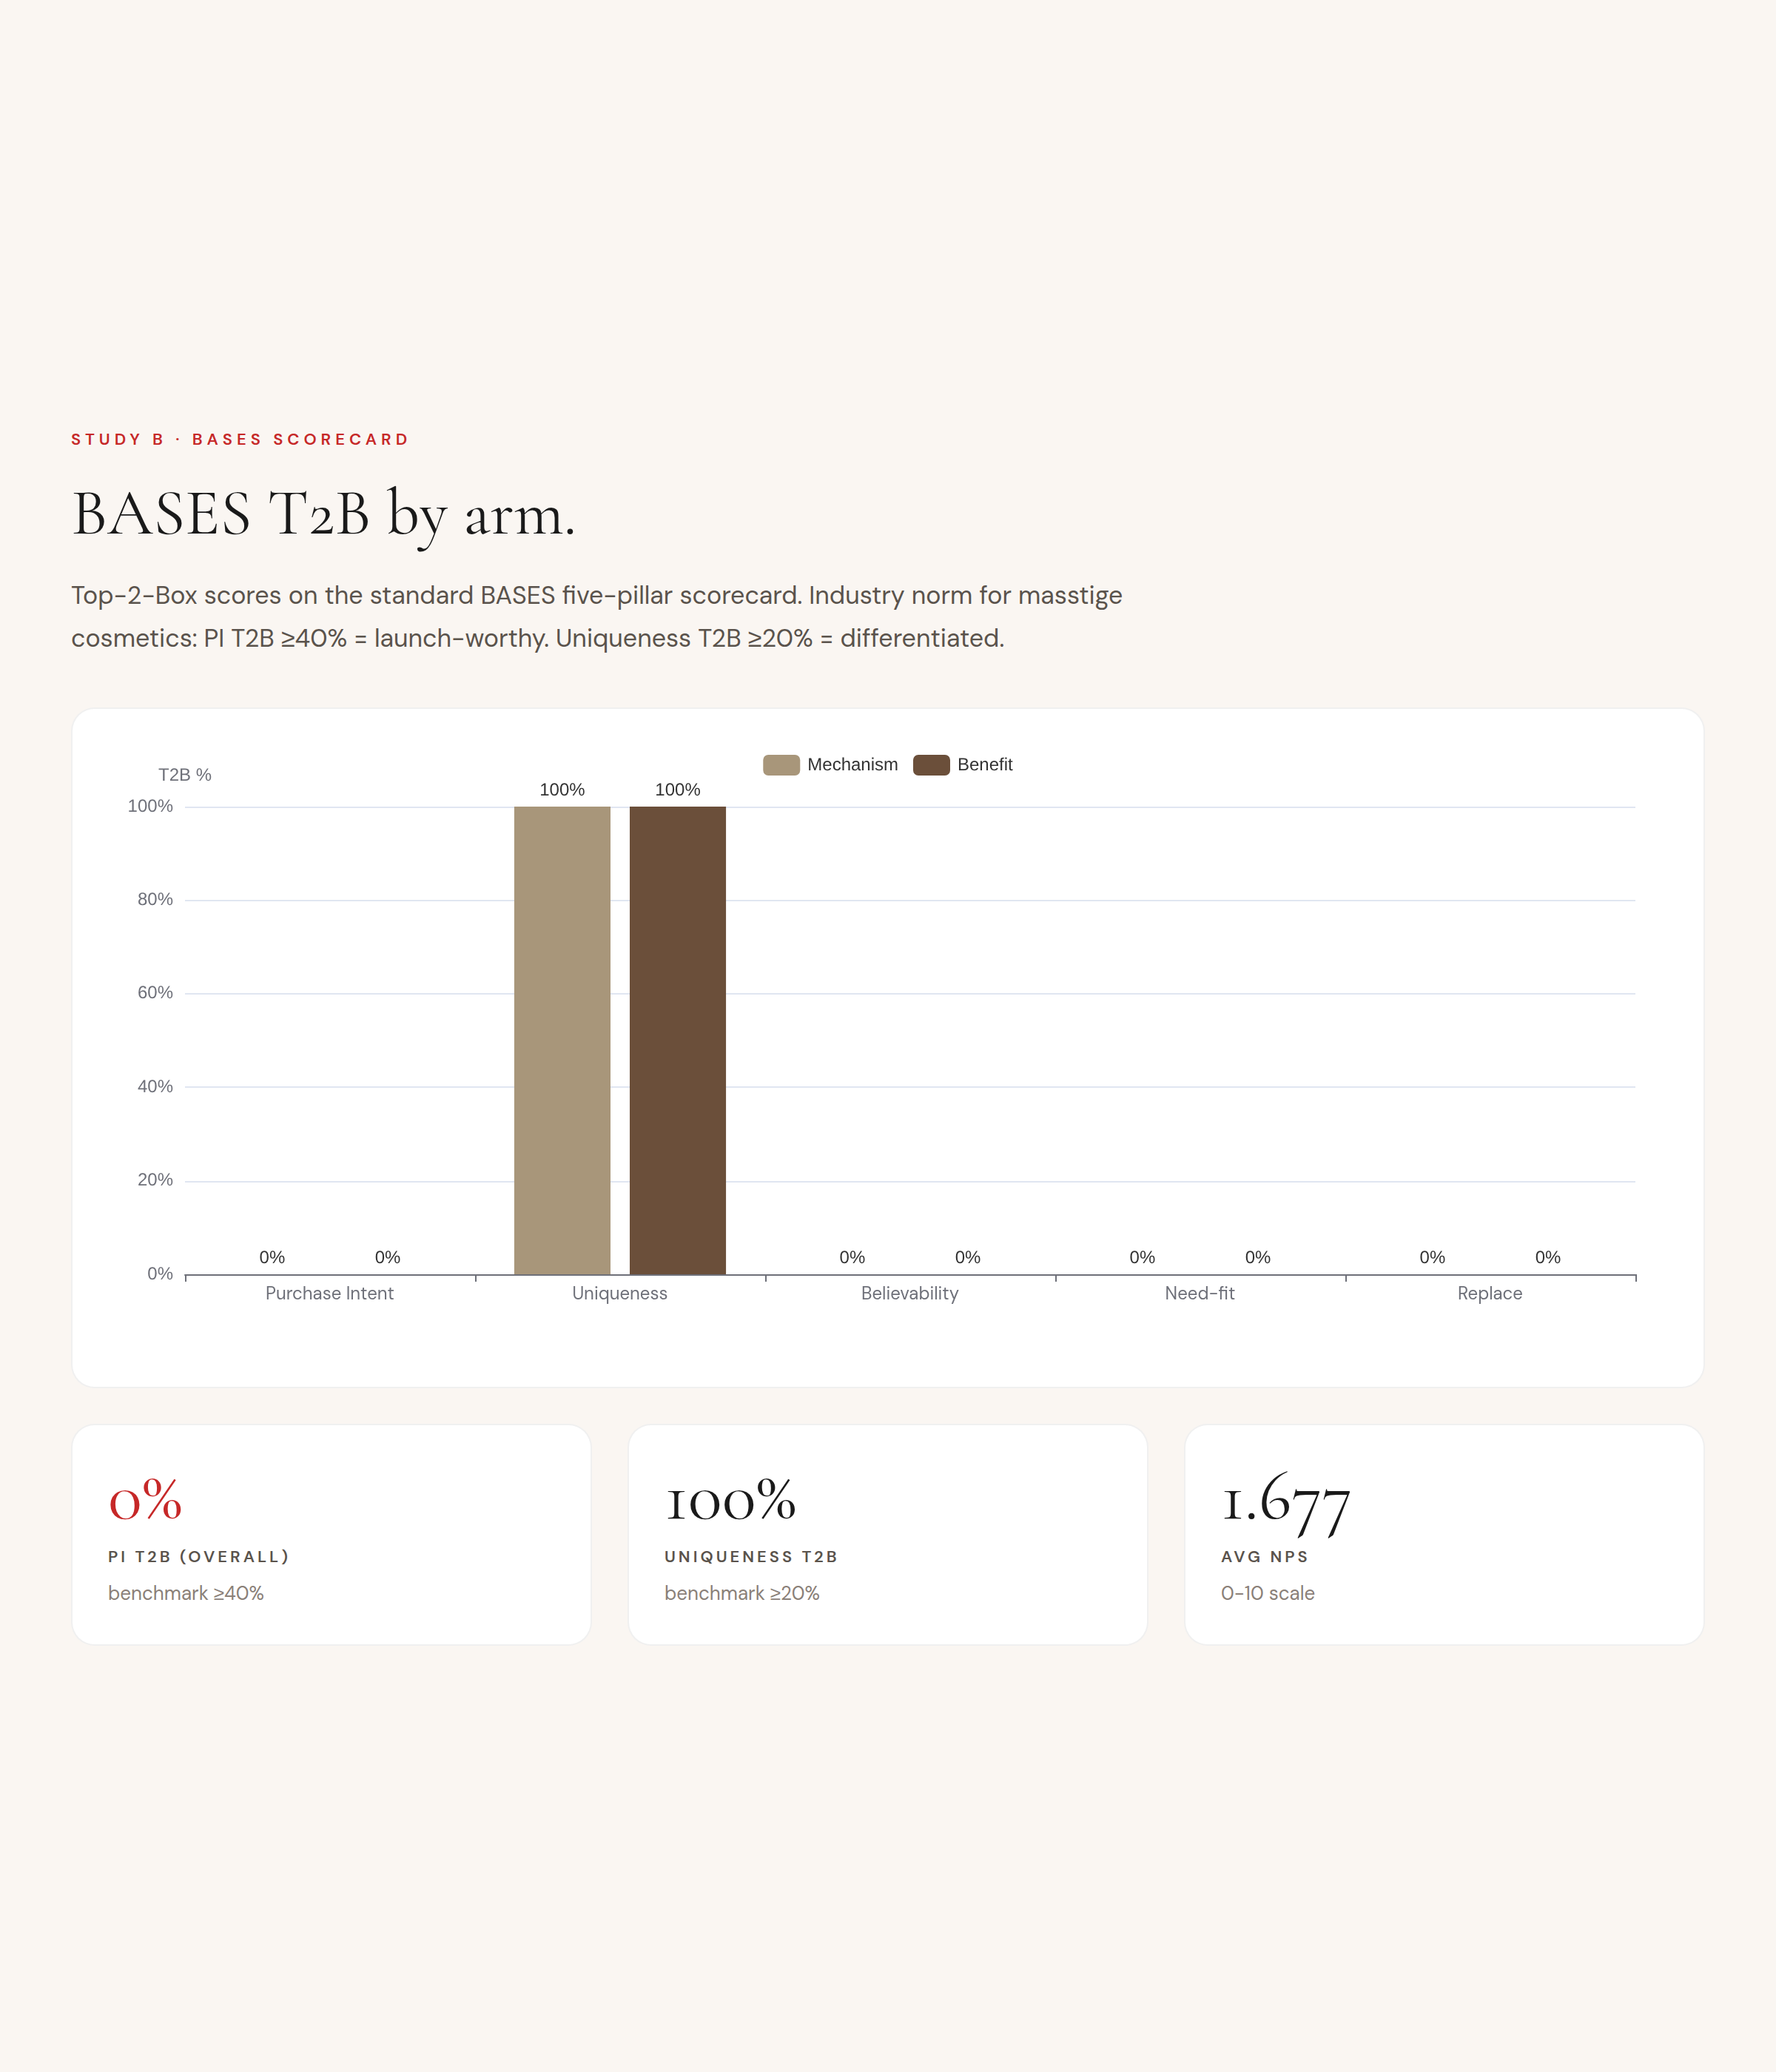
BASES-style scorecard for any new offering: purchase intent, uniqueness, believability, need-fit, value, NPS — with category-comparable benchmarks.
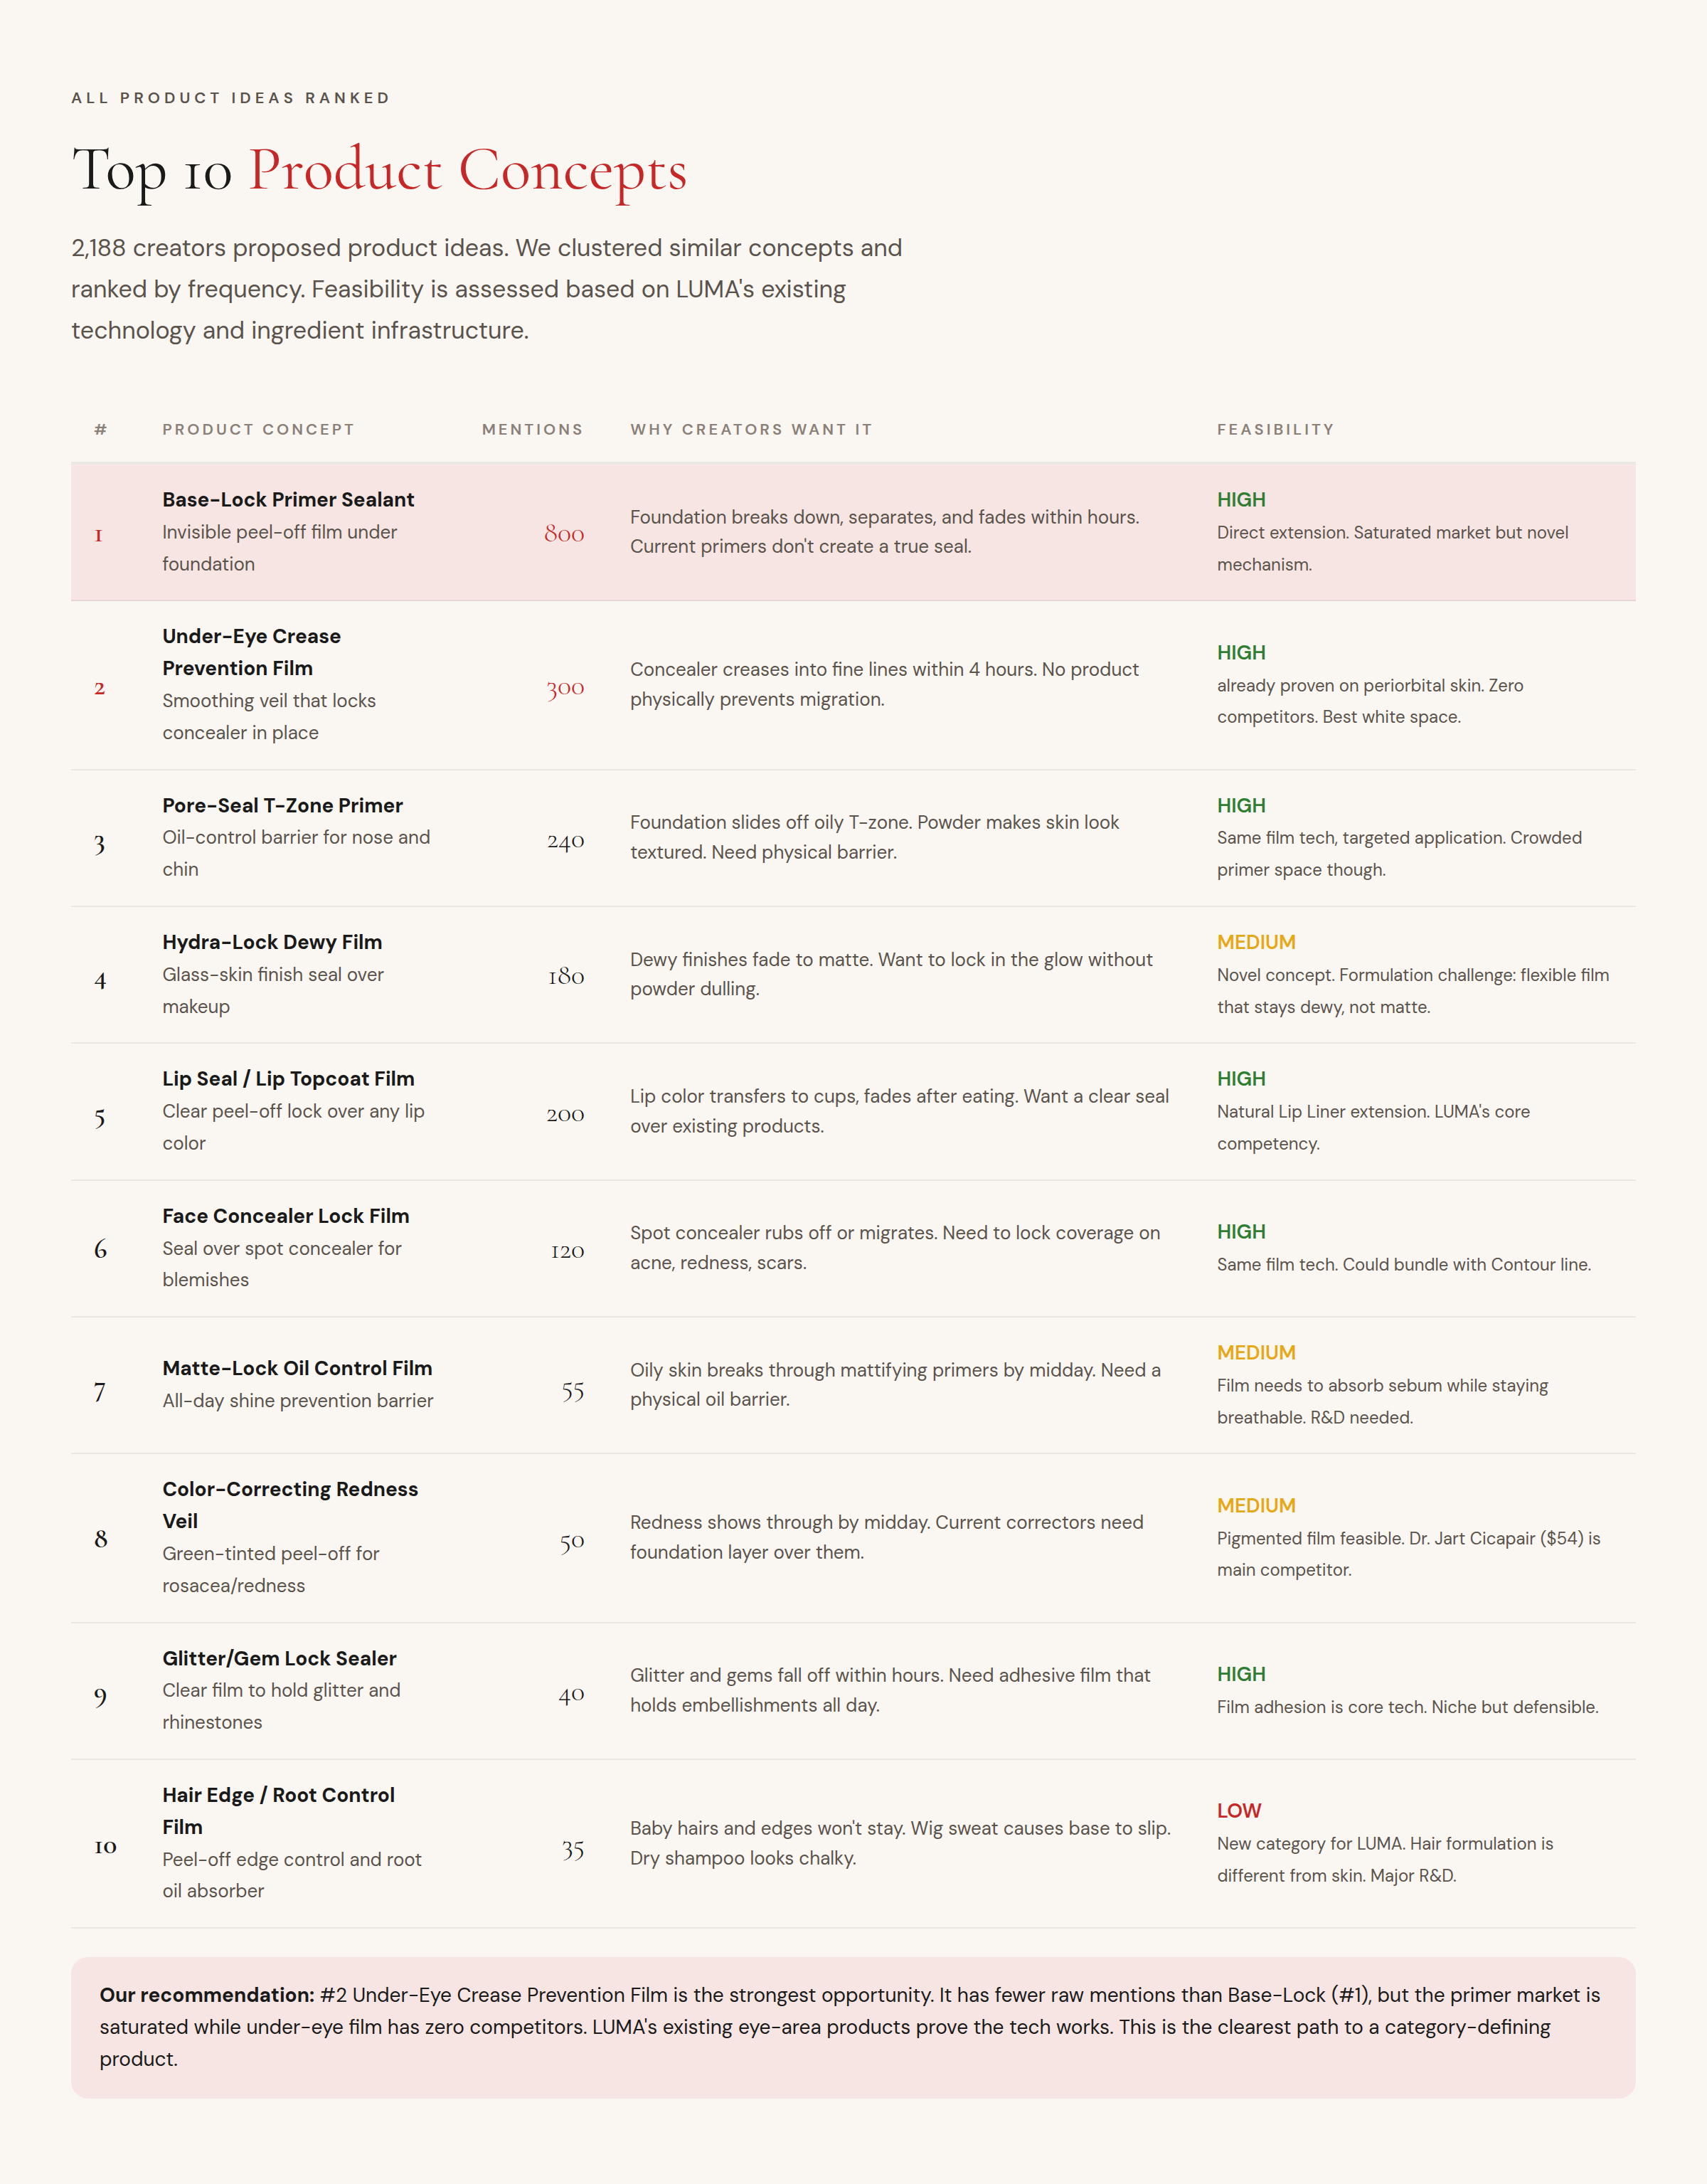
Mine what customers want that you don't make yet — open-ended demand surfaced and ranked into a product-opportunity pipeline.
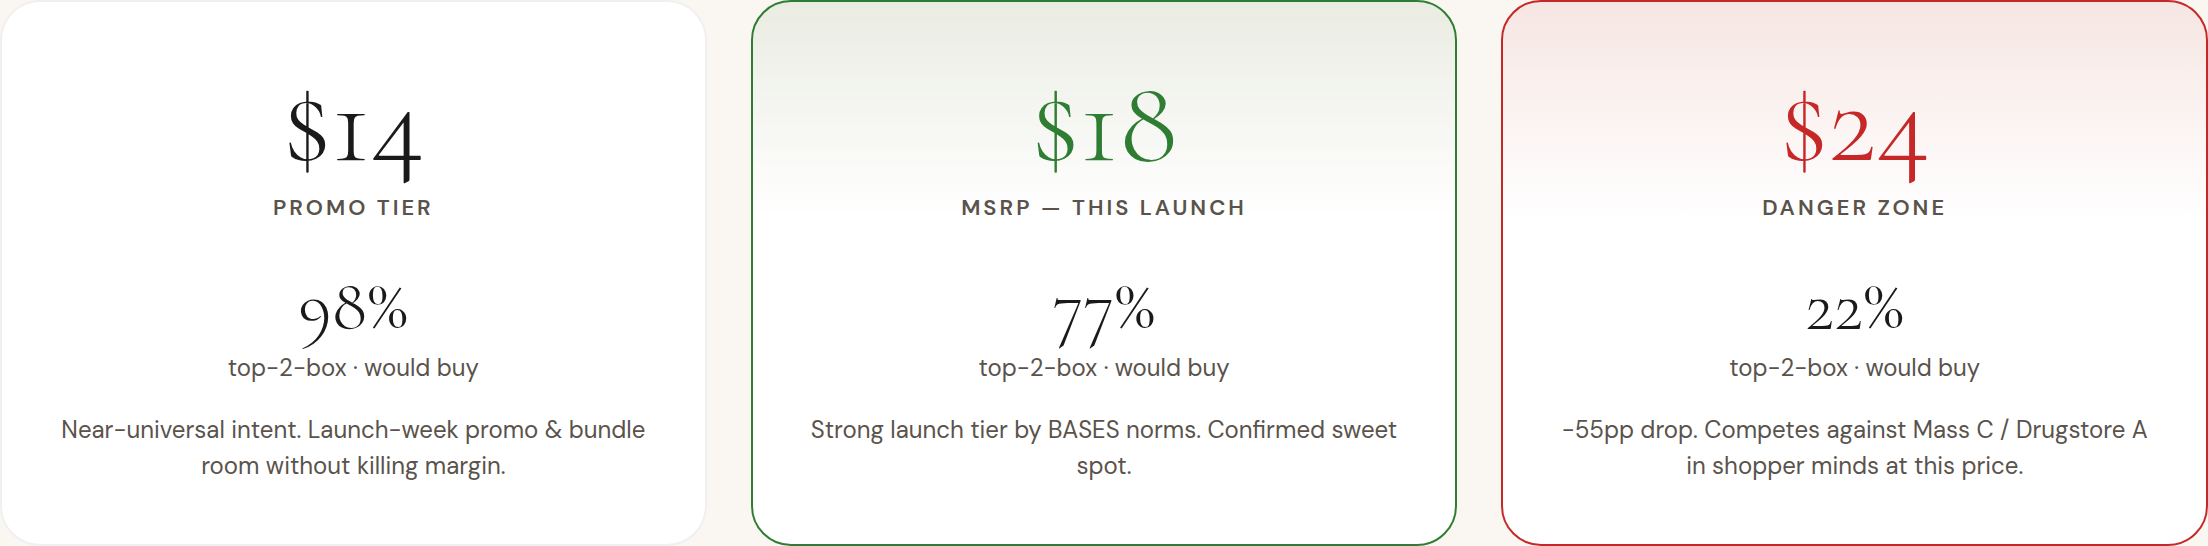
Find the price wall before launch. Test tiers in one study; returns elasticity by segment, the optimal point, and where intent collapses.
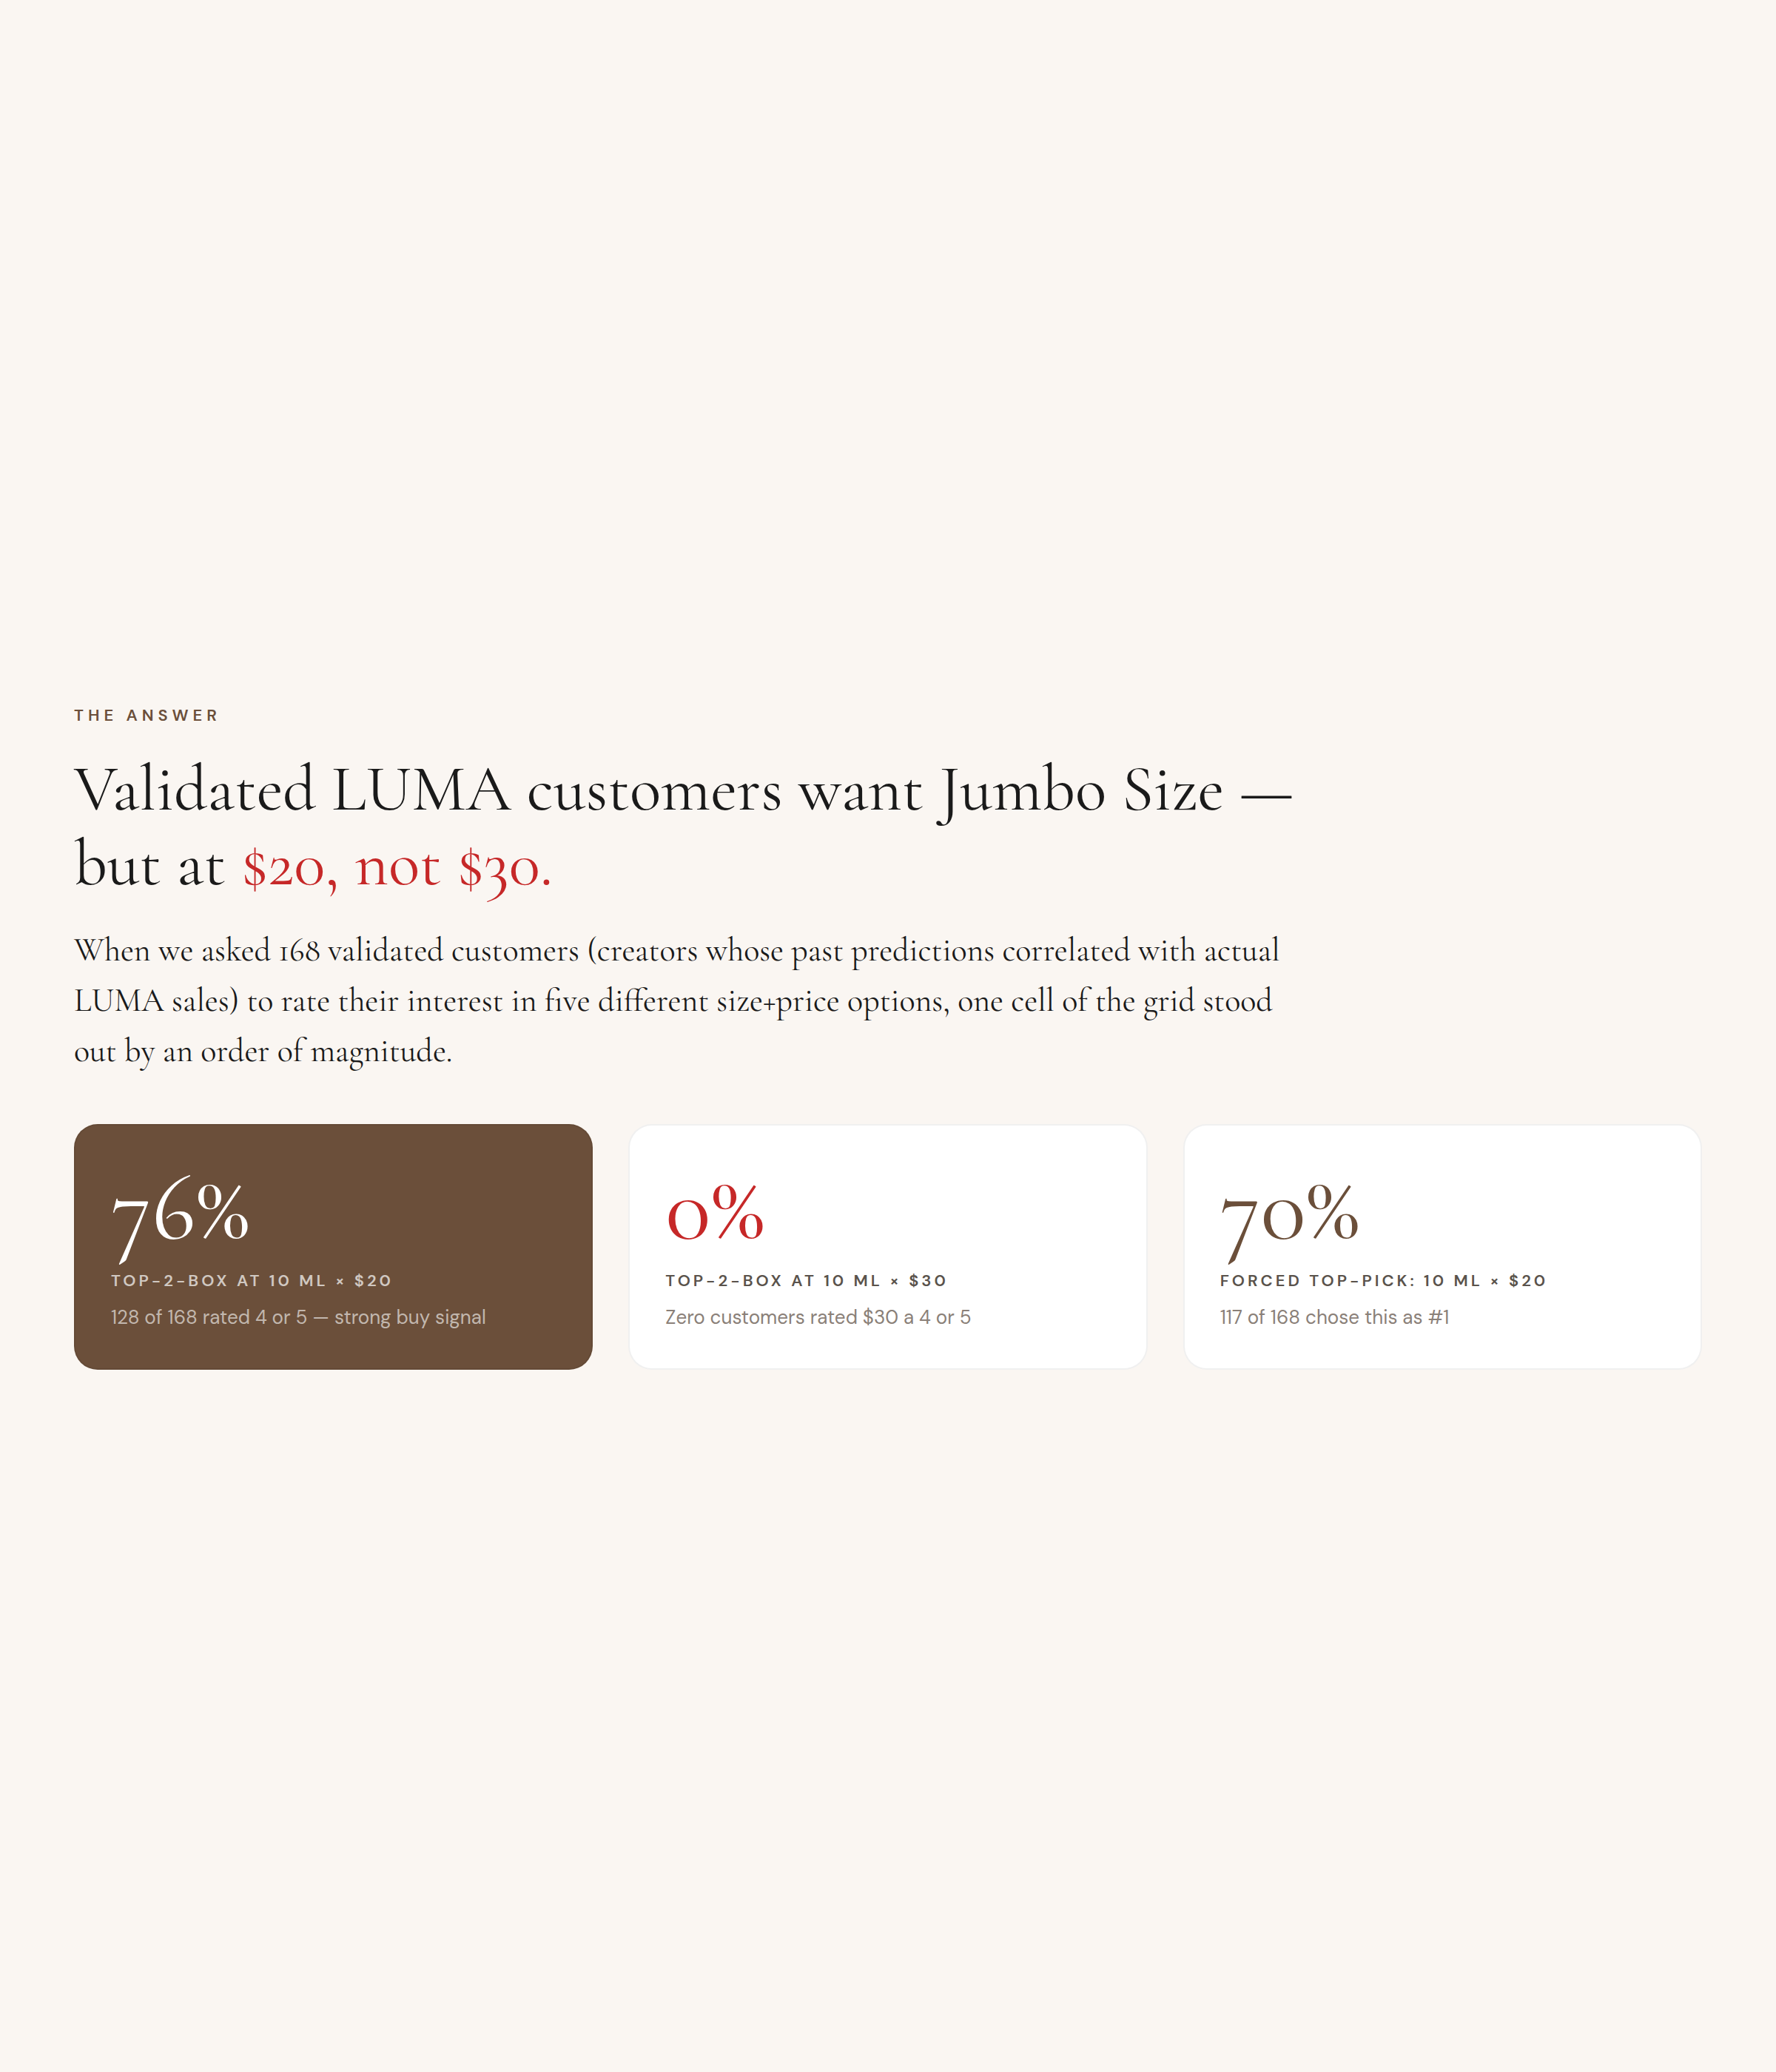
One decisive read — the winning size at the right price, and exactly where the wrong price kills intent.
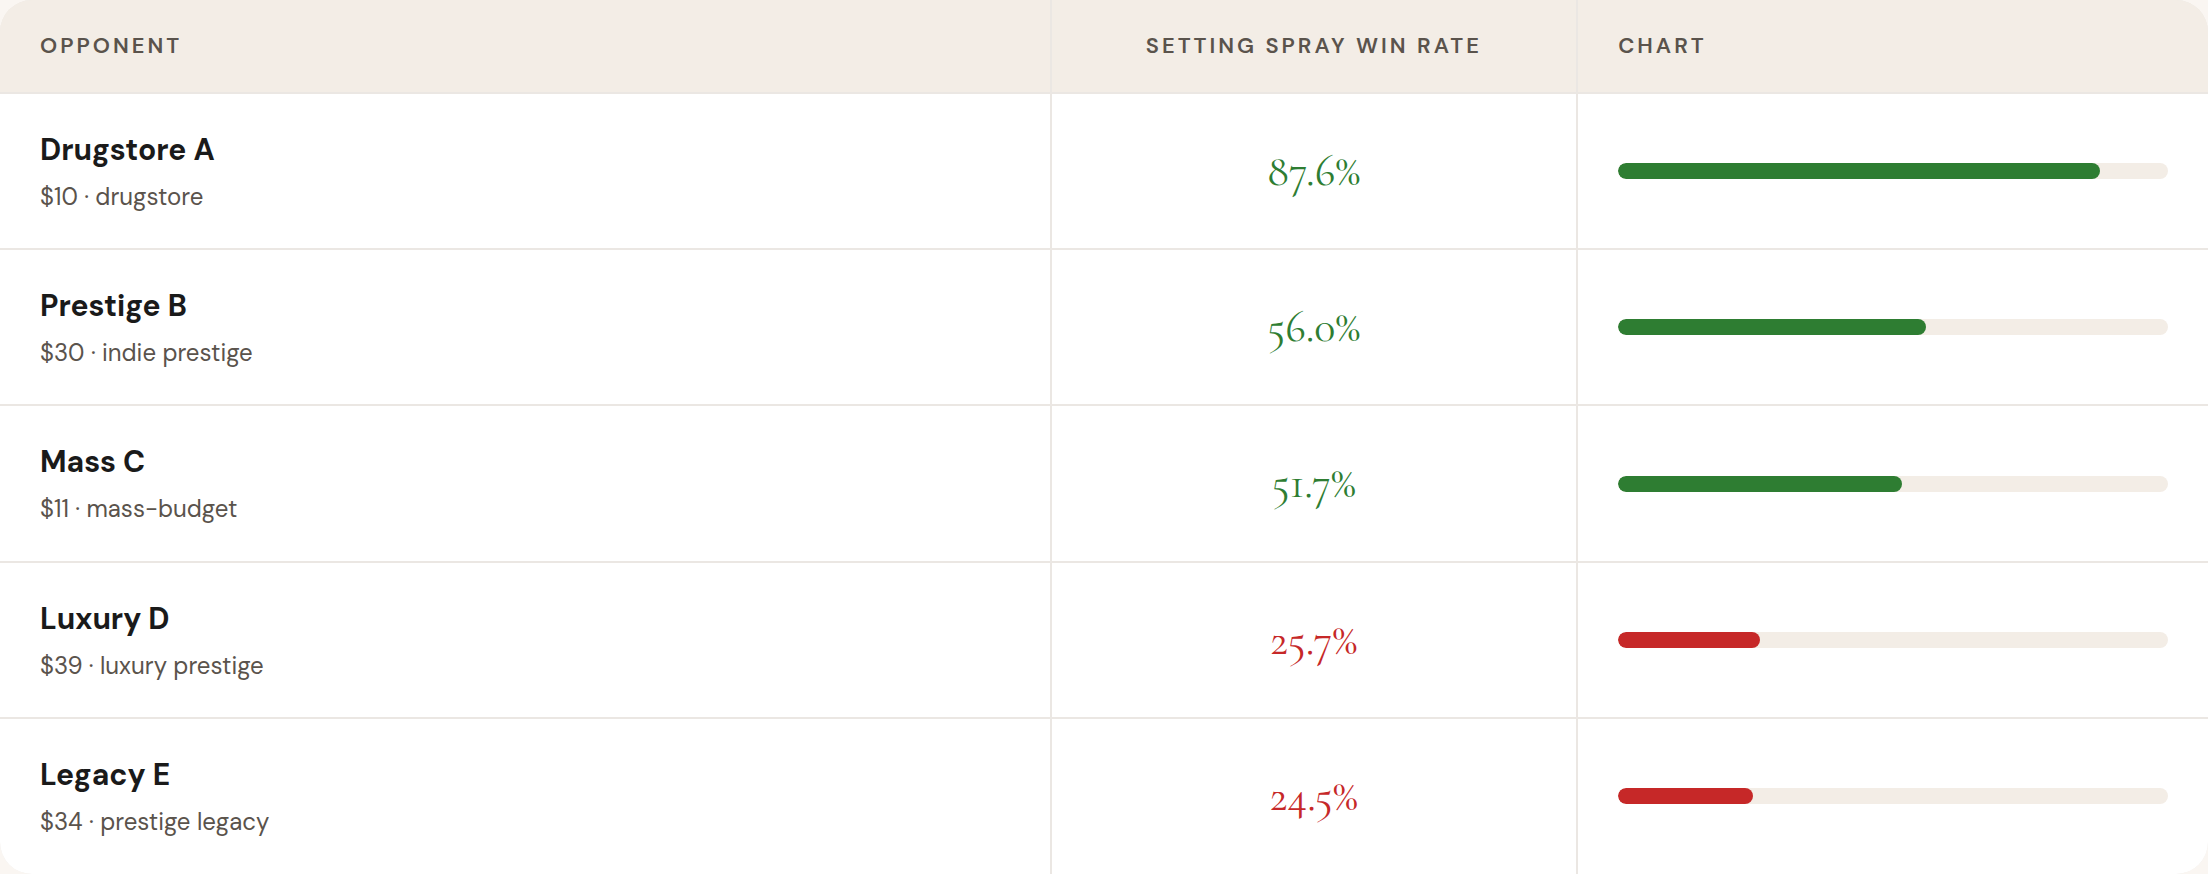
Head-to-head against each competitor tier — where you win, where you lose, and what that means for claims and price.
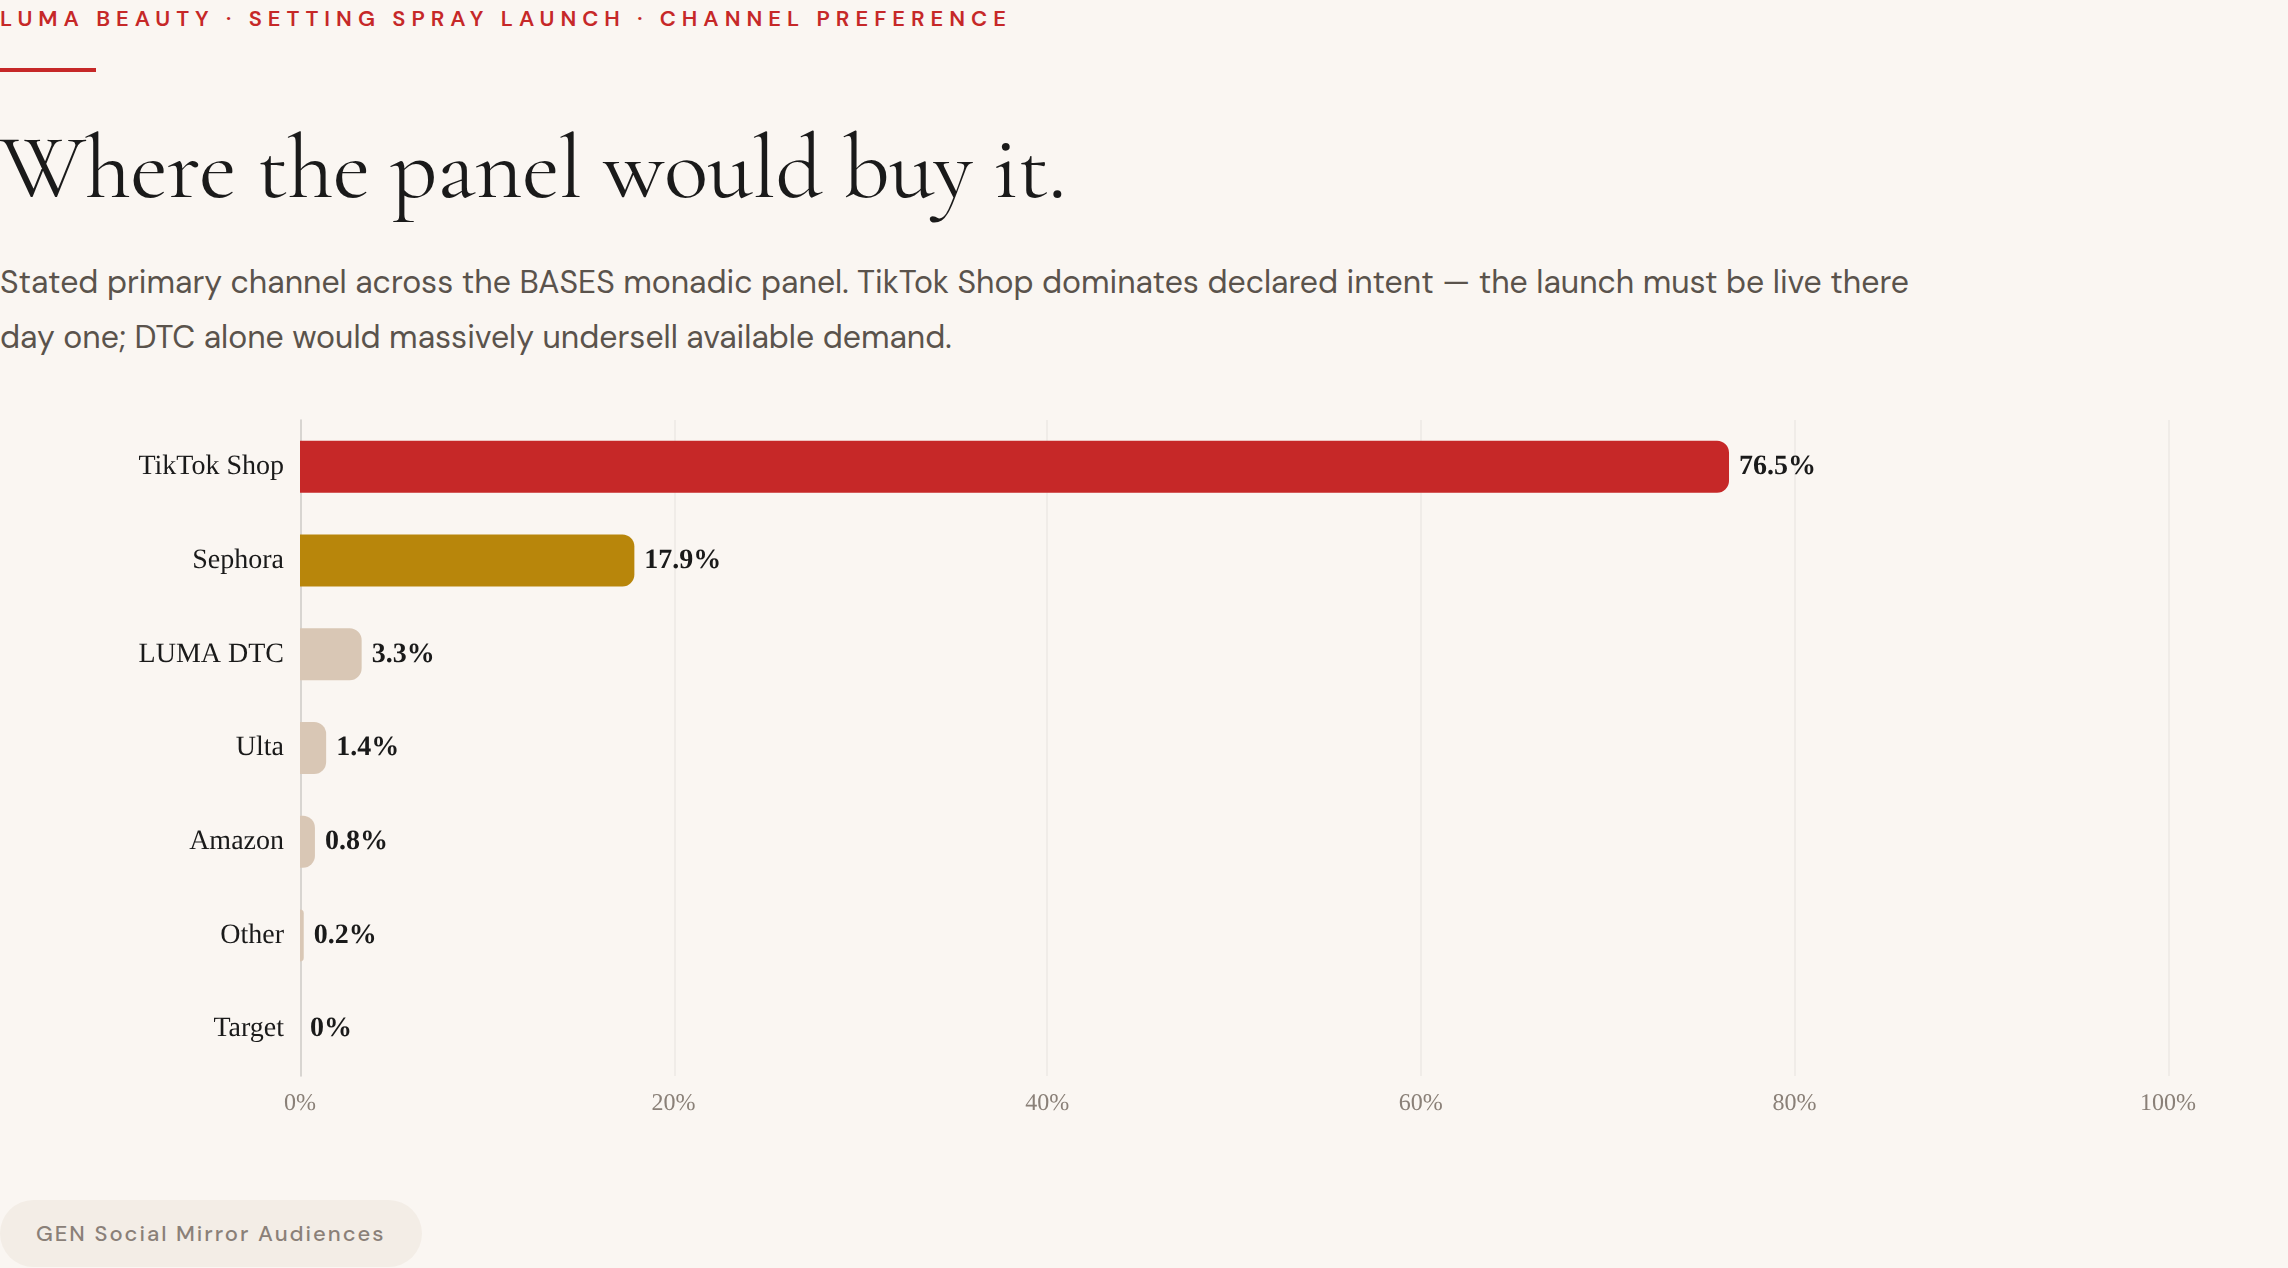
Where the launch should lead — the channels and audiences the panel would actually buy through, so day-one distribution matches real demand.
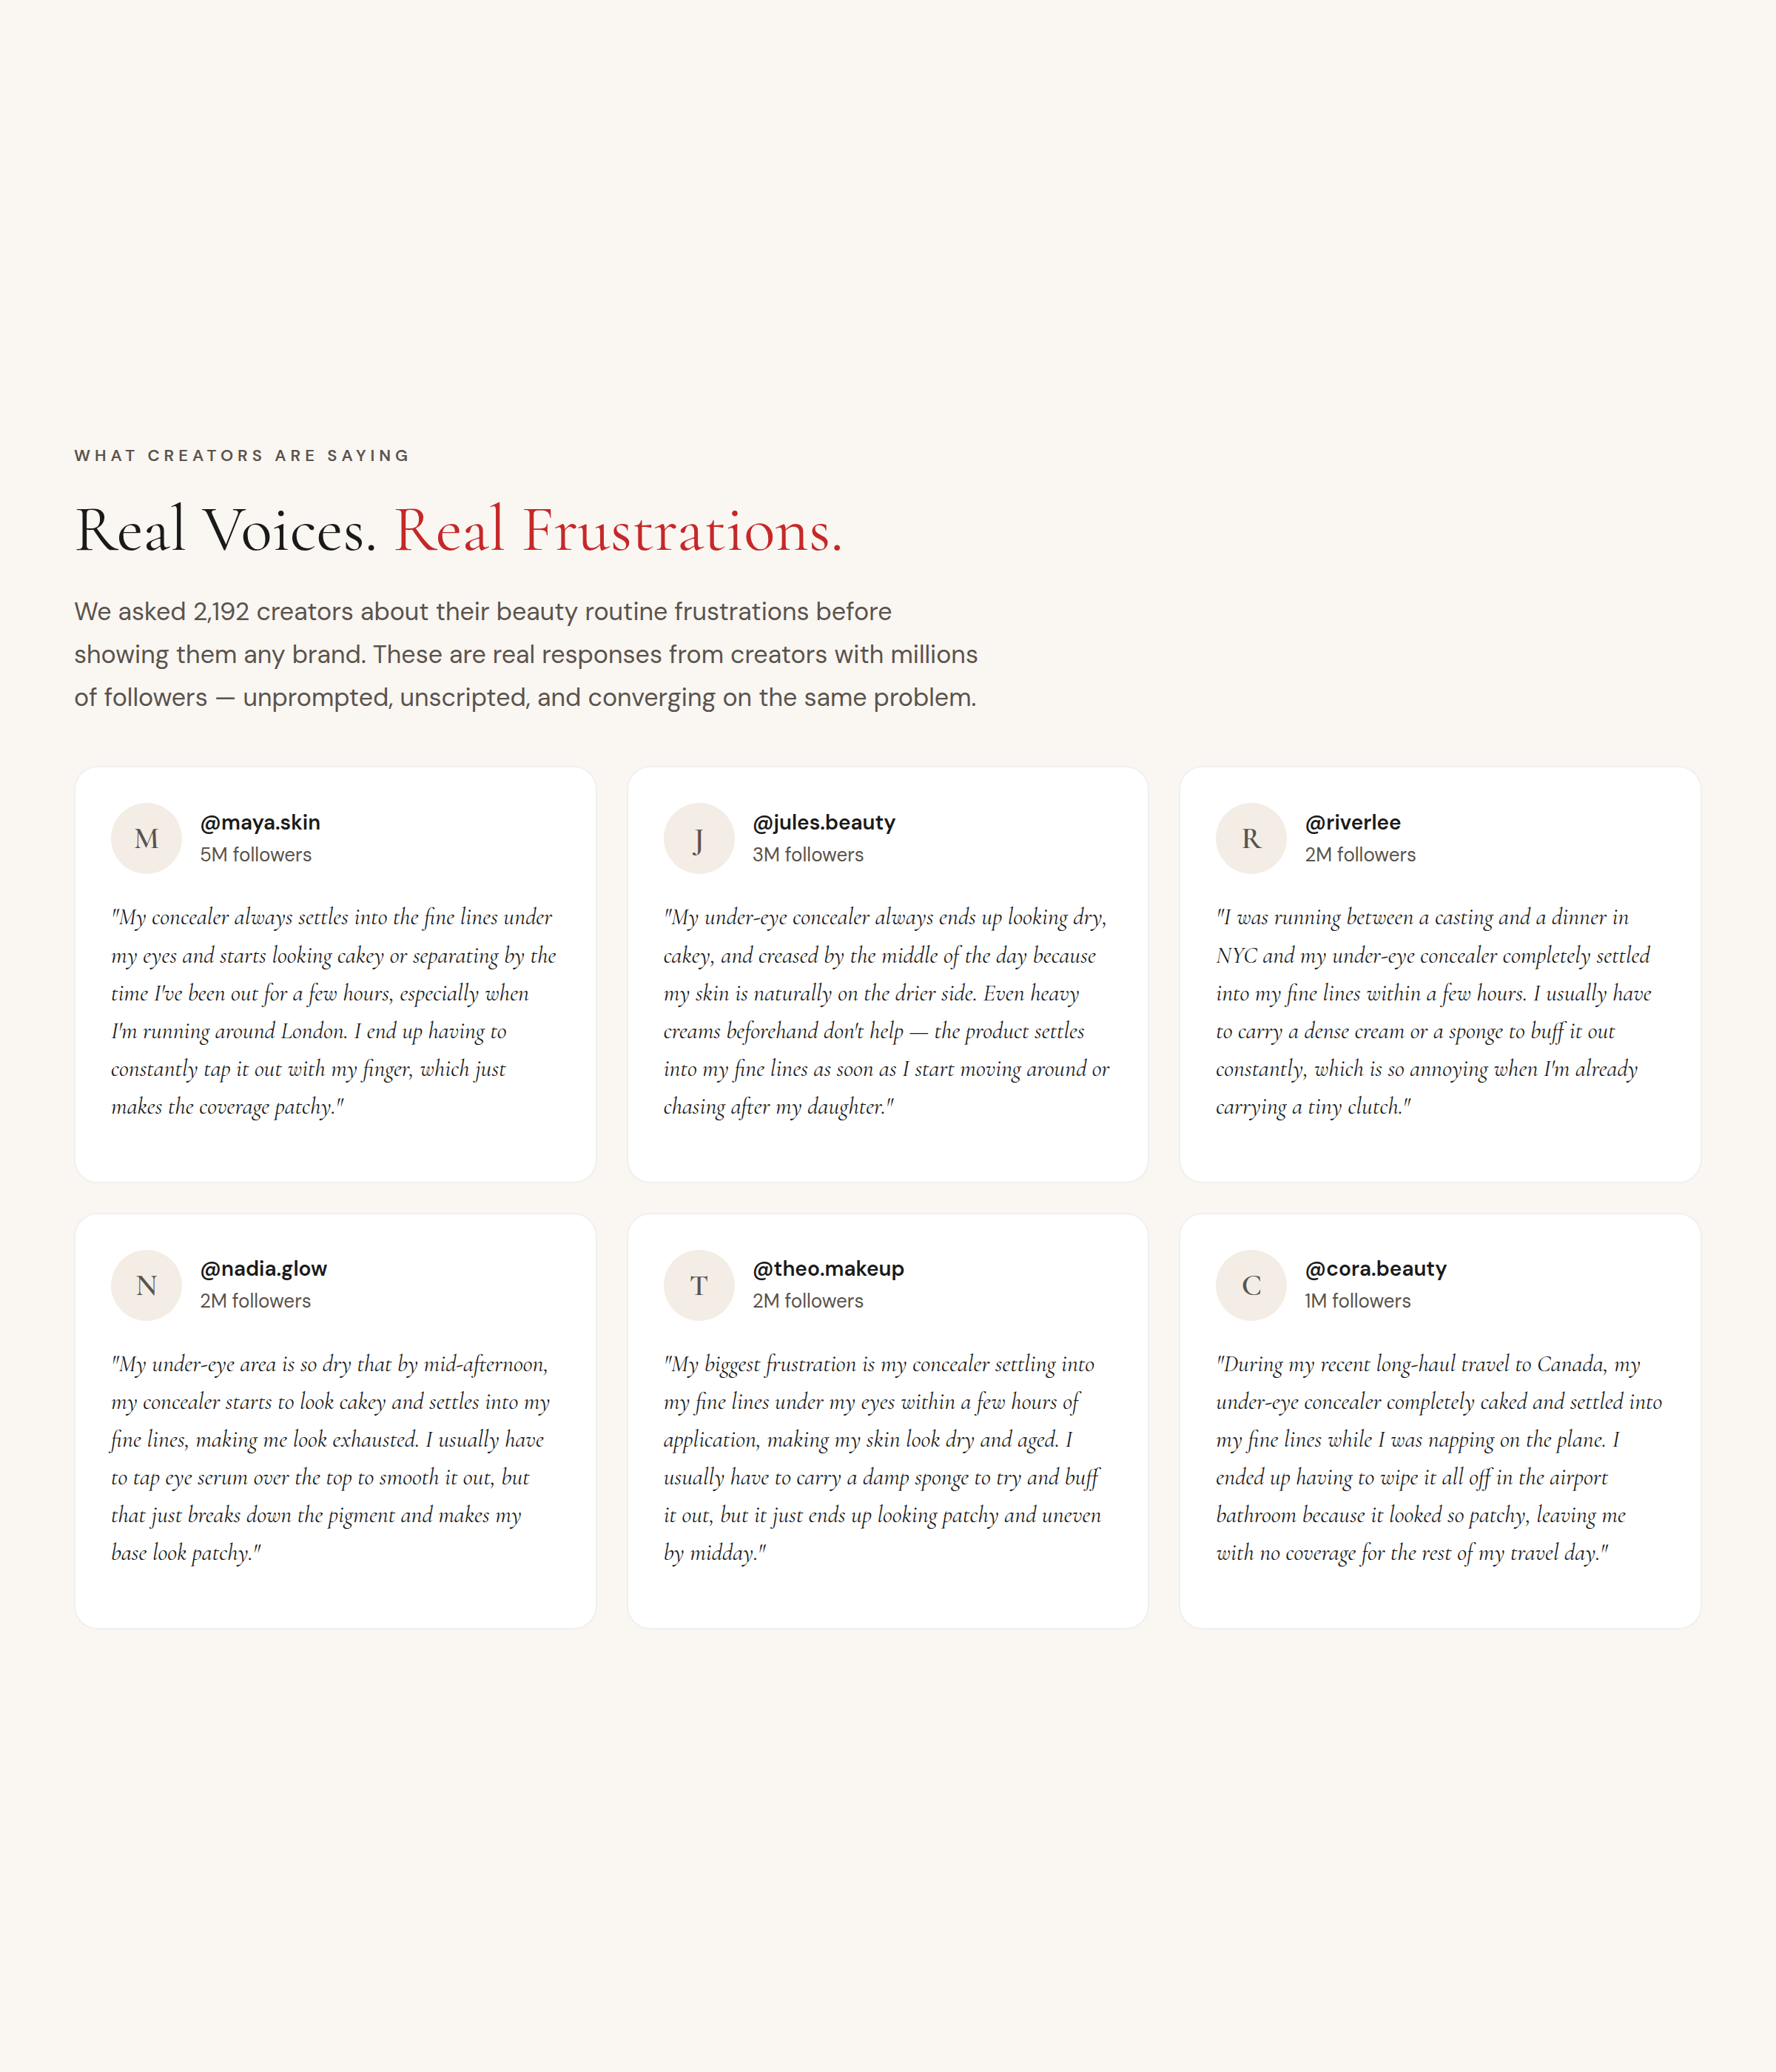
Test claims, hooks, and positioning — and pull the real customer language behind the numbers to sharpen copy. Iterate in minutes.
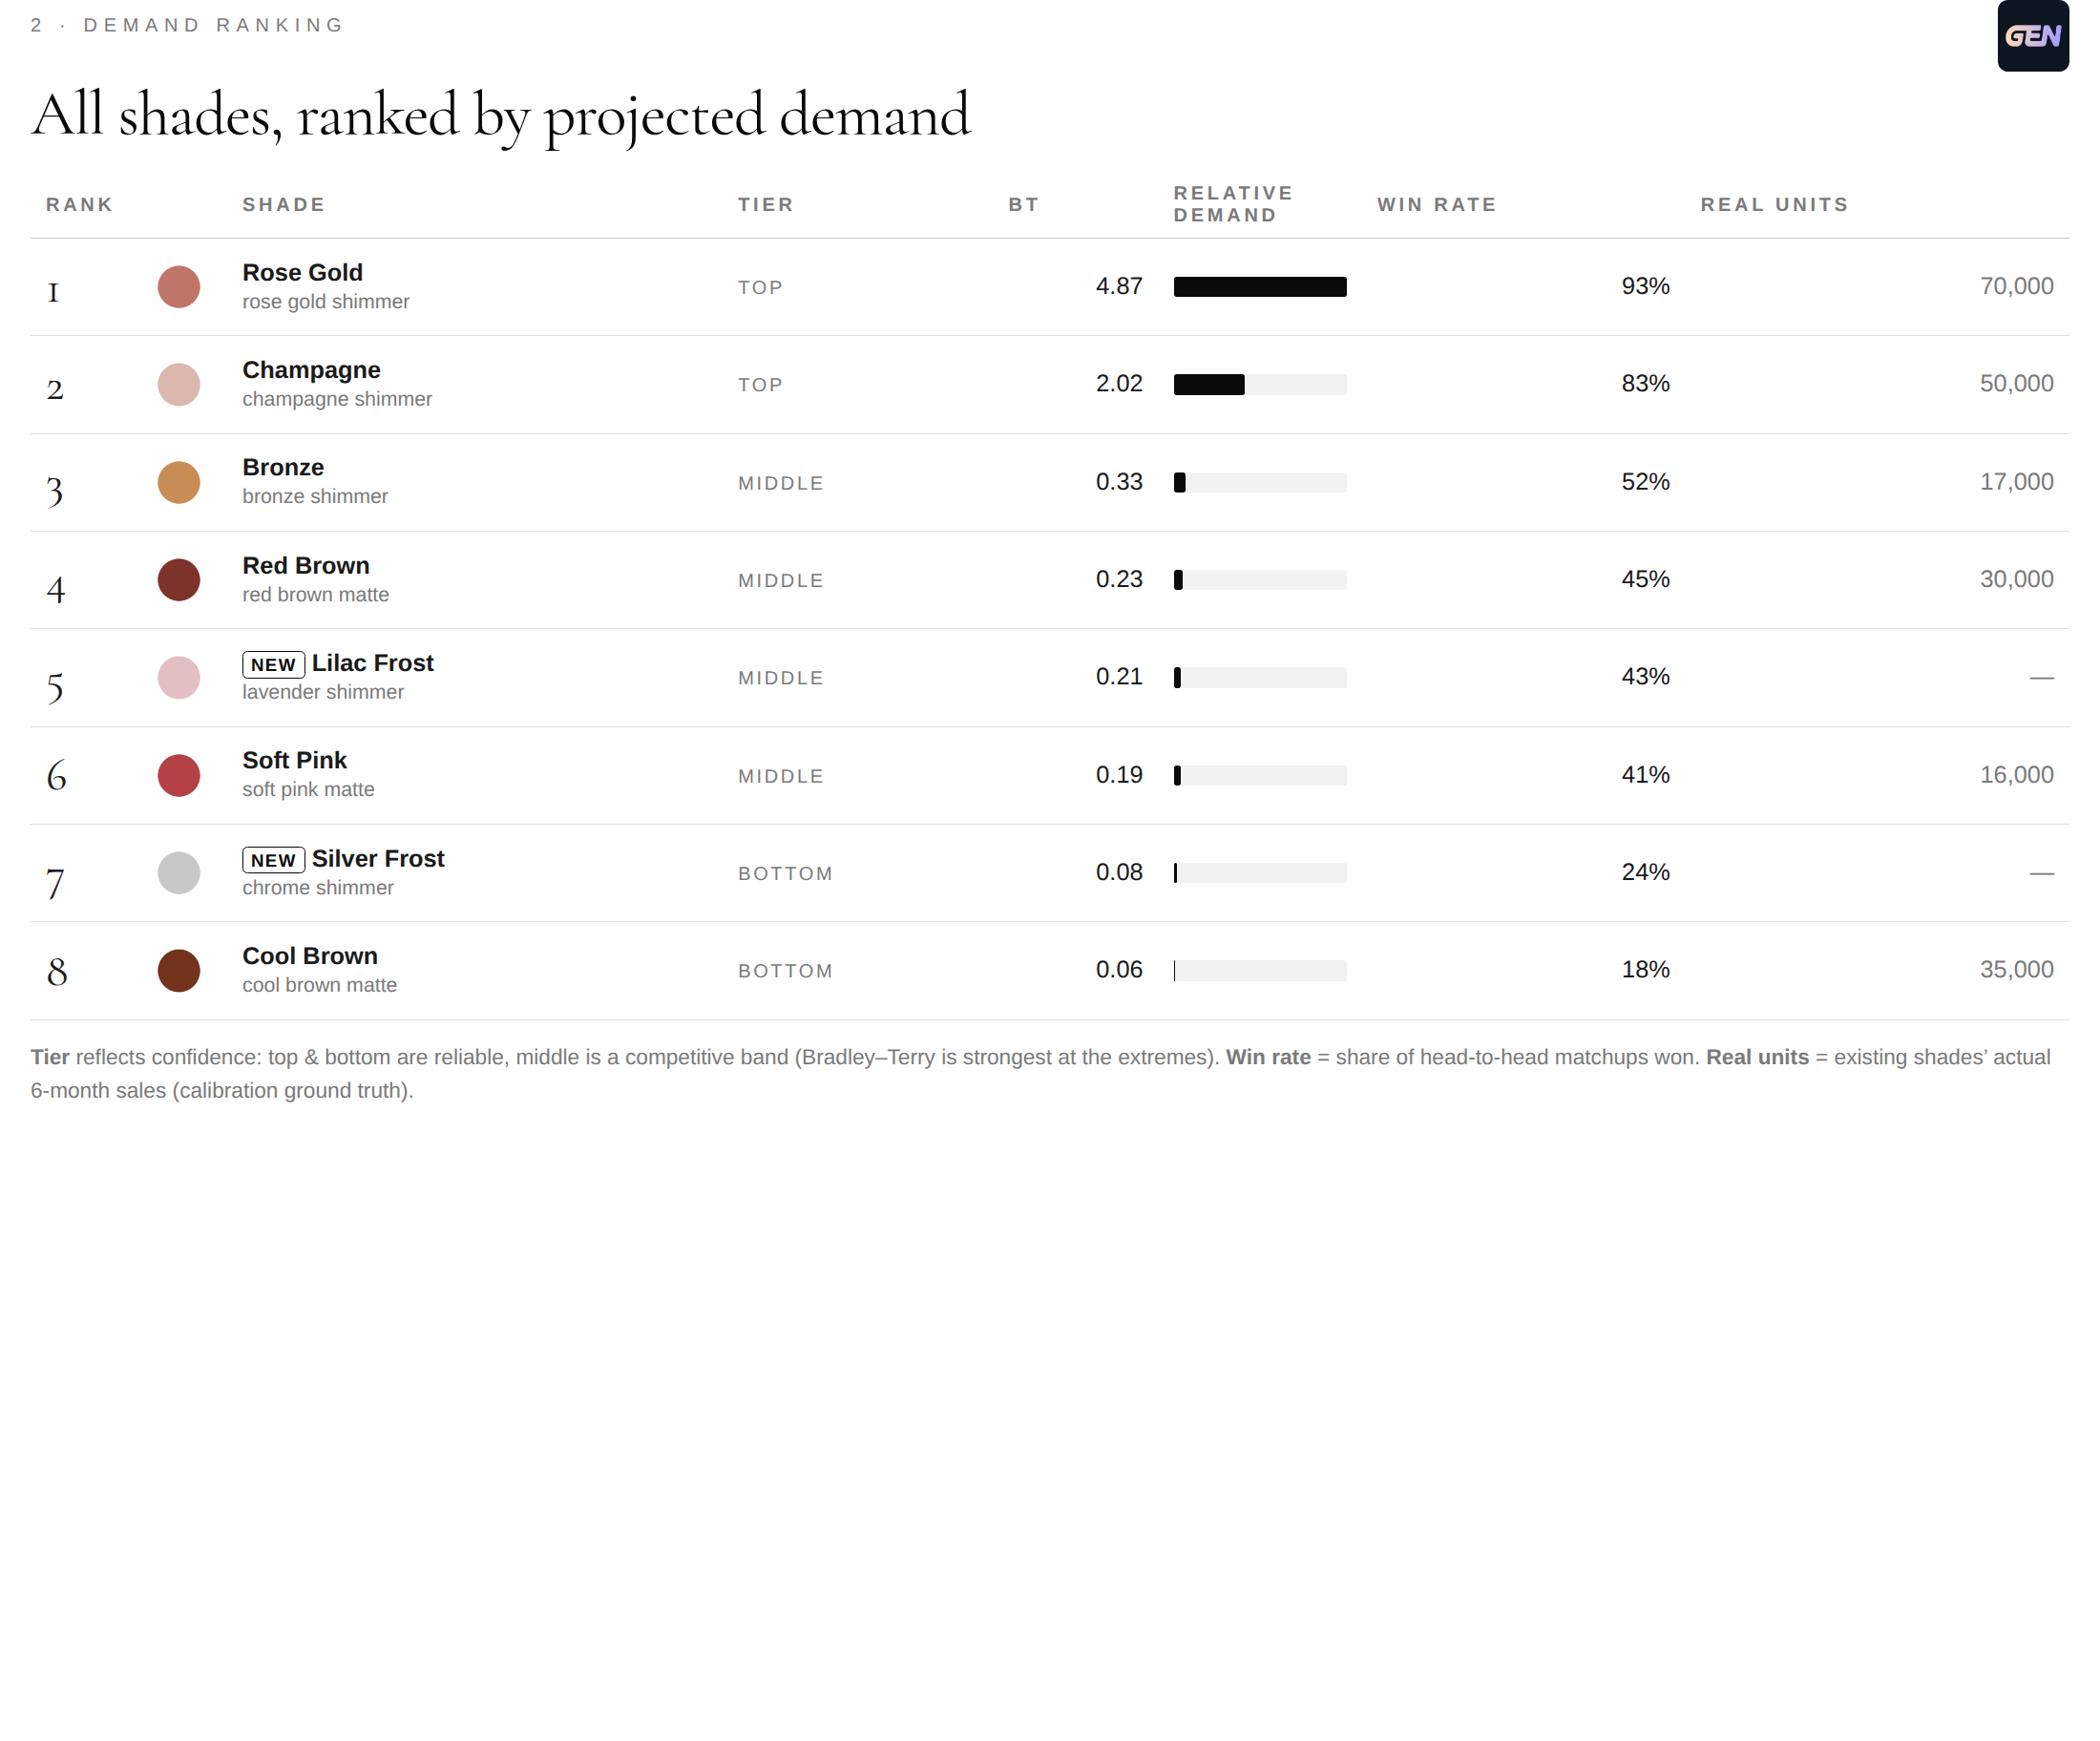
Every shade tiered top-to-bottom, the panel's prediction lined up against real unit sales — the proof the ranking holds.
A leading DTC beauty brand has run SMA across its catalog for months — shade ranges, new concepts, pricing, and positioning. Study after study, the panel's predicted rankings have matched real post-launch sales. The example below: a new lip-liner line where SMA called the exact post-launch order before a single unit was manufactured.
SMA predicted Soft Pink #1 > Cool Nude #2 > Blush Berry #3. Actual post-launch sales confirmed this exact ranking. Traditional top-pick analysis would have gotten #2 and #3 wrong.
What correct predictions mean for a $29M product line
Scope on Monday, calibrate Tuesday, run the panel mid-week, decision-ready report in your inbox before Friday.
Join the brands using patent-pending AI to predict what their customers will buy — before going to market.
Talk to us →